Elkeid - Bytedance Cloud Workload Protection Platform
Elkeid is an open source solution that can meet the security requirements of various workloads such as hosts, containers and K8s, and serverless. It is derived from ByteDance's internal best practices.
With the business development of enterprises, the situation of multi-cloud, cloud-native, and coexistence of multiple workloads has become more and more prominent. We hope that there can be a set of solutions that can meet the security requirements under different workloads, so Elkeid was born.
Introduction
Elkeid has the following key capabilities:
-
Elkeid not only has the traditional HIDS (Host Intrusion Detection System) ability for host layer intrusion detection and malicious file identification, but also can well identify malicious behaviors in containers. The host can meet the anti-intrusion security requirements of the host and the container on it, and the powerful kernel-level data collection capability at the bottom of Elkeid can satisfy the desire of most security analyst for host-level data.
-
For the running business Elkeid has the RASP capability and can be injected into the business process for anti-intrusion protection, not only the operation and maintenance personnel do not need to install another Agent, but also the business does not need to restart.
-
For K8s itself, Elkeid supports collection to K8s Audit Log to perform intrusion detection and risk identification on the K8s system.
-
Elkeid's rule engine Elkeid HUB can also be well linked with external multiple systems.
Ekeid integrates these capabilities into one platform to meet the complex security requirements of different workloads, while also achieving multi-component capability association. What is even more rare is that each component undergoes massive byte-beating. Data and years of combat testing.
Elkeid Community Edition Description
It should be noted that there are differences between the Elkeid open source version and the full version. The current open source capabilities mainly include:
- All on-device capabilities, that is, on-device data/asset/partial collection capabilities, kernel-state data collection capabilities, RASP probe parts, etc., and are consistent with the internal version of ByteDance;
- All backend capabilities, namely Agent Center, service discovery, etc., are consistent with the internal version of ByteDance;
- Provide a community edition rule engine, namely Elkeid HUB, and use it as an example with a small number of strategies;
- Provides community version of Elkeid Console and some supporting capabilities.
Therefore, it is necessary to have complete anti-intrusion and risk perception capabilities, and it is also necessary to construct policies based on Elkeid HUB and perform secondary processing of the data collected by Elkeid.
Elkeid Architecture
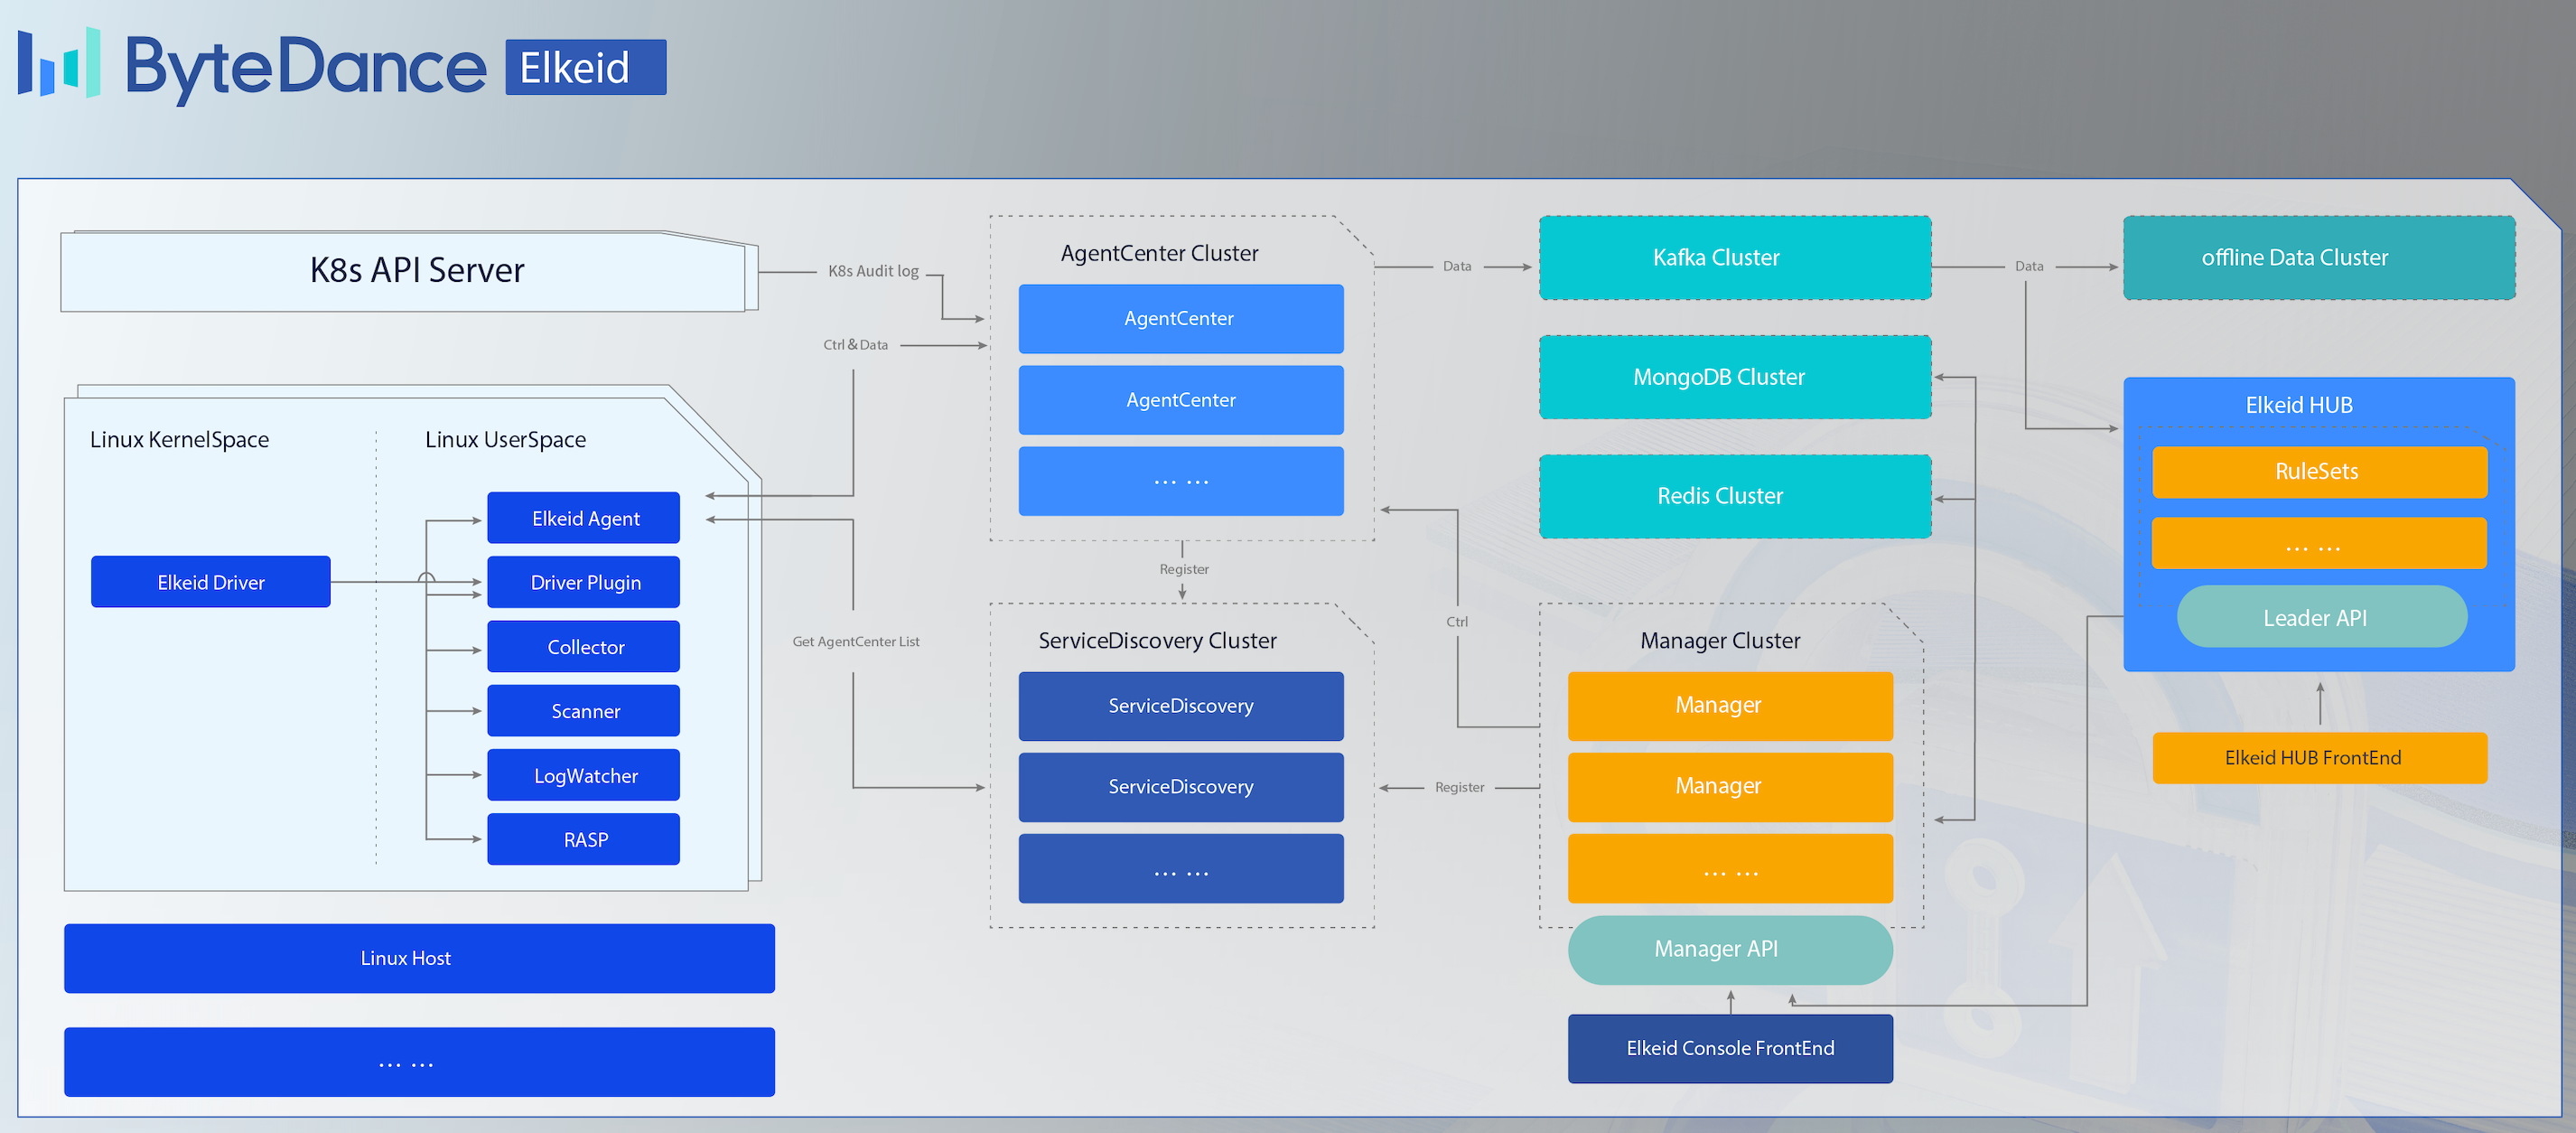
Elkeid Host Ability
- Elkeid Agent Linux userspace agent,responsible for managing various plugin, communication with Elkeid Server.
- Elkeid Driver Driver can collect data on Linux Kernel, support container runtime , communication with Elkeid Driver Plugin.
- Elkeid RASP Support CPython、Golang、JVM、NodeJS、PHP runtime probe, supports dynamic injection into the runtime.
- Elkeid Agent Plugin List
- Driver Plugin: Responsible for managing Elkeid Driver, and process the driver data.
- Collector Plugin: Responsible for the collection of assets/log information on the Linux System, such as user list, crontab, package information, etc.
- Journal Watcher: Responsible for monitoring systemd logs, currently supports ssh related log collection and reporting.
- Scanner Plugin: Responsible for static detection of malicious files on the host, currently supports yara.
- RASP Plugin: Responsible for managing RASP components and processing data collected from RASP.
- Baseline Plugin: Responsible for detecting baseline risks based on baseline check policies.
- Elkeid Data Format
- Elkeid Data Usage Tutorial
Elkeid Backend Ability
- Elkeid AgentCenter Responsible for communicating with the Agent, collecting Agent data and simply processing it and then summing it into the MQ, is also responsible for the management of the Agent, including Agent upgrade, configuration modification, task distribution, etc.
- Elkeid ServiceDiscovery Each component in the background needs to register and synchronize service information with the component regularly, so as to ensure that the instances in each service module are visible to each other and facilitate direct communication.
- Elkeid Manager Responsible for the management of the entire backend, and provide related query and management API.
- Elkeid Console Elkeid Front-end
- Elkeid HUB Elkeid HIDS RuleEngine
Elkeid Function List
| Ability List | Elkeid Community Edition | Elkeid Enterprise Edition |
|---|---|---|
| Linux runtime data collection | :white_check_mark: | :white_check_mark: |
| RASP probe | :white_check_mark: | :white_check_mark: |
| K8s Audit Log collection | :white_check_mark: | :white_check_mark: |
| Agent control plane | :white_check_mark: | :white_check_mark: |
| Host Status and Details | :white_check_mark: | :white_check_mark: |
| Extortion bait | :ng_man: | :white_check_mark: |
| Asset collection | :white_check_mark: | :white_check_mark: |
| Asset Collection Enhancements | :ng_man: | :white_check_mark: |
| K8s asset collection | :white_check_mark: | :white_check_mark: |
| Exposure and Vulnerability Analysis | :ng_man: | :white_check_mark: |
| Host/Container Basic Intrusion Detection | few samples | :white_check_mark: |
| Host/Container Behavioral Sequence Intrusion Detection | :ng_man: | :white_check_mark: |
| RASP Basic Intrusion Detection | few samples | :white_check_mark: |
| RASP Behavioral Sequence Intrusion Detection | :ng_man: | :white_check_mark: |
| K8S Basic Intrusion Detection | few samples | :white_check_mark: |
| K8S Behavioral Sequence Intrusion Detection | :ng_man: | :white_check_mark: |
| K8S Threat Analysis | :ng_man: | :white_check_mark: |
| Alarm traceability (behavior traceability) | :ng_man: | :white_check_mark: |
| Alarm traceability (resident traceability) | :ng_man: | :white_check_mark: |
| Alert Whitelist | :white_check_mark: | :white_check_mark: |
| Multi-alarm aggregation capability | :ng_man: | :white_check_mark: |
| Threat Repsonse (Process) | :ng_man: | :white_check_mark: |
| Threat Repsonse (Network) | :ng_man: | :white_check_mark: |
| Threat Repsonse (File) | :ng_man: | :white_check_mark: |
| File isolation | :ng_man: | :white_check_mark: |
| Vulnerability discovery | few vuln info | :white_check_mark: |
| Vulnerability information hot update | :ng_man: | :white_check_mark: |
| Baseline check | few baseline rules | :white_check_mark: |
| Application Vulnerability Hotfix | :ng_man: | :white_check_mark: |
| Virus scan | :white_check_mark: | :white_check_mark: |
| User behavior log analysis | :ng_man: | :white_check_mark: |
| Agent Plugin management | :white_check_mark: | :white_check_mark: |
| System monitoring | :white_check_mark: | :white_check_mark: |
| System Management | :white_check_mark: | :white_check_mark: |
| Windows Support | :ng_man: | :white_check_mark: |
| Honey pot | :ng_man: | :oncoming_automobile: |
| Active defense | :ng_man: | :oncoming_automobile: |
| Cloud virus analysis | :ng_man: | :oncoming_automobile: |
| File-integrity monitoring | :ng_man: | :oncoming_automobile: |
Front-end Display (Community Edition)
Security overview
K8s security alert list
K8s pod list
Host overview
Resource fingerprint
intrusion alert overwiew
Vulnerability
Baseline check
Virus scan
Backend hosts monitoring
Backend service monitoring
Console User Guide
Quick Start
Contact us && Cooperation

Lark Group
About Elkeid Enterprise Edition
Elkeid Enterprise Edition supports separate intrusion detection rules(like the HIDS, RASP, K8s) sales, as well as full capacity sales.
If interested in Elkeid Enterprise Edition please contact elkeid@bytedance.com
Elkeid Docs
For more details and latest updates, see Elkeid docs.
License
- Elkeid Driver: GPLv2
- Elkeid RASP: Apache-2.0
- Elkeid Agent: Apache-2.0
- Elkeid Server: Apache-2.0
- Elkeid Console: Elkeid License
- Elkeid HUB: Elkeid License
404StarLink 2.0 - Galaxy
Elkeid has joined 404Team 404StarLink 2.0 - Galaxy
ElkeidUP
Automated deployment of Elkeid tools
Component List
Instructions
- The backend server used for deployment needs to be used by Elkeid only
- The back-end server used for deployment needs to ensure intranet interoperability
- The backend server used for deployment requires root user privileges when deploying
- The backend server used for deployment can only be used: Centos7 and above; Ubuntu16 and above; Debian9 and above
- The server which execute elkeidup could execute
ssh root@x.x.x.xwithout password to any backend server - Deployment cannot be manually interrupted
- Only cat use LAN IP, do not use 127.0.0.1 or hostname or public IP
- Don't remove
~/.elkeidupdir - Don't fix any components used user's password, Include the Console(Elkeid Manager)
Awareness of Auto-download missing kernel driver service
In this open-source version, we have integrated a service to provide auto-download capabilities for kernel driver files of those kernel versions that are missing from pre-compiled lists.
Service background: Elkeid Driver works in the kernel state. Since the kernel module loaded by the kernel is strongly bound to the kernel version, the kernel driver would have to match the correct kernel version. We cannot occupy the resources of the client's computer to compile ko files on the client's host machines when installing the agent. Therefore, we precompiled kernels for major Linux system distributions in the release package to fit general cases. Currently, there are a total of 3435 precompiled ko, but there are still two problems that cannot be solved. One is that it cannot be updated in real-time. After the Major Linux system distributions release new updates to the kernel, we cannot and do not have enough manpower to catch up with those changes in time. The other problem is that you may use your own Linux kernel distribution. To this end, we provide the function of automatically downloading the missing precompiled kernel drivers. This function is mainly to inform our relevant engineer that some specific kernel versions are being used by users, and the release version should be updated as soon as possible. If you choose to agree and enable this service, we need to collect some basic operating information at the same time, so that we can customize priority scheduling according to users with different needs, and give a reasonable evaluation of resource occupation. The email information filled in is only used to distinguish the identity of the source, real email or any nickname can be used. Specific information is as follows:
- The kernel version and server architecture (only arm64 or amd64 can be selected, and no other CPU machine information is involved).
- The number of connections of the agent on the agent center is collected every 30 minutes.
- The QPS of the agent on the agent center, including send and receive, is collected every 30 minutes, and the average value of 30 minutes is taken.
- The hub input QPS is collected every 30 minutes, and the average value of 30 minutes is taken.
- Redis QPS, collected every 30 minutes, takes an average value of 30 minutes.
- Redis memory usage, collected every 30 minutes, real-time value.
- The QPS produced and consumed by Kafka are collected every 30 minutes, and the average value of 30 minutes is taken.
- MongoDB QPS, collects every 30 minutes, and takes an average value of 30 minutes.
If you do not agree to enable this service, you can still have access to all pre-compiled ko included in the release package, and all other functions will not be affected.
The specific operation is to download ko_1.7.0.9.tar.xz on the release interface, and then replace package/to_upload/agent/component/driver/ko.tar.xz. During deployment, ko will be decompressed to /elkeid/nginx/ElkeidAgent/agent/component/driver/ko directory.
You may simply enable related functions during the elkeidup deployment progress. The relative config could also bee found inside elkeidup_config.yaml file in the conf directory where the manager is running based upon. If you enable this service during deployment, but need to disable it in the subsequent process, you can set report.enable_report in the elkeidup_config.yaml file to false, and then restart the manager.
The codes for collecting information and downloading KO files from Elkeid services are all in the open-sourced code. The relevant functions are listed as follows.
- The on/off switch is located in the InitReport() function of
internal/monitor/report.go. - The collection information item is located in the heartbeatDefaultQuery structure of
internal/monitor/report.go. - The function of automatically downloading ko is located in the SendAgentDriverKoMissedMsg function of
biz/handler/v6/ko.go.
Elkeid Deployment(Recommended)
Elkeid HUB Deployment
Elkeid Upgrading and Expansion
Raw Data Usage Tutorial
Elkeid Full Deployment
1、Stand-alone docker rapid deployment (stand-alone testing environment recommended)
1.1、Import Mirroring
wget https://github.com/bytedance/Elkeid/releases/download/v1.9.1.4/elkeidup_image_v1.9.1.tar.gz.00
wget https://github.com/bytedance/Elkeid/releases/download/v1.9.1.4/elkeidup_image_v1.9.1.tar.gz.01
wget https://github.com/bytedance/Elkeid/releases/download/v1.9.1.4/elkeidup_image_v1.9.1.tar.gz.02
wget https://github.com/bytedance/Elkeid/releases/download/v1.9.1.4/elkeidup_image_v1.9.1.tar.gz.03
cat elkeidup_image_v1.9.1.tar.gz.* > elkeidup_image_v1.9.1.tar.gz

docker load -i elkeidup_image_v1.9.1.tar.gz
1.2、Run the container
docker run -d --name elkeid_community \
  --restart=unless-stopped \
  -v /sys/fs/cgroup:/sys/fs/cgroup:ro \
  -p 8071:8071 -p 8072:8072 -p 8080:8080 \
  -p 8081:8081 -p 8082:8082 -p 8089:8080  -p 8090:8090\
  --privileged \
  elkeid/all-in-one:v1.9.1
1.3、Set external IP
Using this machine IP cannot use 127.0.0.1.
docker exec -it elkeid_community bash

cd /root/.elkeidup/

# This command will start interactive input
./elkeidup public {ip}


./elkeidup agent init
./elkeidup agent build
./elkeidup agent policy create

cat ~/.elkeidup/elkeid_passwd
1.4、Access the front console and install Agent
After a successful installation, the /root/.elkeidup/elkeid_passwd file records the passwords and associated URLs of each component.
The initial password is fixed when mirroring is built, please do not use it in the production environment for security
| Field | Description |
|---|---|
| elkeid_console | Console account password |
| elkeid_hub_frontend | hub front-end account password |
| grafana | grafana account password |
| grafana | grafana address |
| elkeid_hub_frontend | elkeid hub front-end address |
| elkeid_console | elkeid console address |
| elkeid_service_discovery | Service Discovery Address |
To access elkeid_console, follow the Console instruction manual - Install configuration to install and deploy the Agent.
2、Full deployment with elkeidup
2.1、Configure the target machine root user ssh ssh password-free login
If the deployment machine is local, you still need to configure the local password-free login, and the login time needs to be less than 1s. The following command can be used to verify that the output of the two date commands needs to be the same.
date && ssh root@{ip} date
# The output time difference should be less than 1s
2.2、Download the release product and configure the catalog
- Download the release product (rolled compressed packet) and merge compressed packets
wget https://github.com/bytedance/Elkeid/releases/download/v1.9.1.4/elkeidup_package_v1.9.1.tar.gz.00
wget https://github.com/bytedance/Elkeid/releases/download/v1.9.1.4/elkeidup_package_v1.9.1.tar.gz.01
wget https://github.com/bytedance/Elkeid/releases/download/v1.9.1.4/elkeidup_package_v1.9.1.tar.gz.02
cat elkeidup_package_v1.9.1.tar.gz.* > elkeidup_package_v1.9.1.tar.gz
You can also refer to Build Elkeid from Source to compile and build packages yourself.
If installed before, delete the
/root/.elkeidupand/elkeidfolders to avoid interference
- Unzip and release products and configuration catalog
mkdir -p /root/.elkeidup && cd /root/.elkeidup
mv {DownloadDir}/elkeidup_package_v1.9.1.tar.gz elkeidup_package_v1.9.1.tar.gz
tar -xf elkeidup_package_v1.9.1.tar.gz
chmod a+x /root/.elkeidup/elkeidup
2.3、Generate and modify config.yaml
If it is not a standalone deployment, please refer to the deployment resource manual to modify config.yaml
cd /root/.elkeidup
./elkeidup init --host {ip}
mv config_example.yaml config.yaml
2.4、Deployment
cd /root/.elkeidup

# This command will start interactive input
./elkeidup deploy
2.5、Build Agent
cd /root/.elkeidup

./elkeidup agent init
./elkeidup agent build
./elkeidup agent policy create
2.6、Access the front console and install Agent
After a successful installation, the /root/.elkeidup/elkeid_passwd file records the passwords and associated URLs of each component.
| Field | Description |
|---|---|
| elkeid_console | Console account password |
| elkeid_hub_frontend | hub front-end account password |
| grafana | grafana account password |
| grafana | grafana address |
| elkeid_hub_frontend | elkeid hub front-end address |
| elkeid_console | elkeid console address |
| elkeid_service_discovery | Service Discovery Address |
To access elkeid_console, follow the Console instruction manual - Install configuration to install and deploy the Agent.
3、Agent Install Remark
- Driver module dependency pre-compile ko, specific support list reference: ko_list
- Under normal circumstances, after the installation of the Agent is completed, it takes about 10 minutes for the Driver module to work normally (involving the automatic download and installation of KO).
- The way the Driver exists:
lsmod | grep hids_driver- If the test machine kernel version is not in the supported list, compile ko file and generate sign file (sha256) and import it into Nginx.
- If you do not agree to the declaration in the execution of elkeidup deploy, you also need to compile ko yourself or download the corresponding pre-compile ko (support list) and sign files in the Release, and import it into Nginx.
3.1, ko import Nginx method
The format of the ko/sign file should follow: hids_driver_1.7.0.4_{uname -r}_{arch}.ko/sign format, the file needs to be placed on the corresponding nginx server: /elkeid/nginx/ElkeidAgent/agent/component/driver/ko, and modify the permissions chown -R nginx: nginx /elkeid/nginx. After the placement is completed, the Agent can be restarted.
4、HTTPS配置
Elkeid https Configuration documentation
5、Upgrade specified components
If a component has been updated, or if a component has been recompiled, you can reinstall the specified component using the elkeidup reinstall command. For example, the Hub Community Edition has been updated in release: v 1.9.1.1, and you can reinstall it with the following command.
# {v1.9.1.1} is the unzipped package directory for v1.9.1.1
# reinstall hub
cp {v1.9.1.1}/package/hub/hub.tar.gz /root/.elkeidup/package/hub/hub.tar.gz
cp {v1.9.1.1}/package/hub_leader/hub_leader.tar.gz /root/.elkeidup/package/hub_leader/hub_leader.tar.gz

/root/.elkeidup/elkeidup reinstall --component Hub
/root/.elkeidup/elkeidup reinstall --component HubLeader
HUB deployed separately
If you need to deploy the HUB separately, you can use the -- hub_only parameter in elkeidup. The specific steps are as follows:
1、Configure the target machine root user ssh ssh password-free login
If the deployment machine is local, you still need to configure the local password-free login, and the login time needs to be less than 1s. The following command can be used to verify that the output of the two date commands needs to be the same.
date && ssh root@{ip} date
# The output time difference should be less than 1s
2、Download the release product and configure the catalog
mkdir -p /root/.elkeidup && cd /root/.elkeidup
wget https://github.com/bytedance/Elkeid/releases/download/v1.9.4/elkeidup_hub_v1.9.1.tar.gz -O elkeidup.tar.gz && tar -xf elkeidup.tar.gz
chmod a+x /root/.elkeidup/elkeidup
3、Generate and modify config.yaml
If it is not a standalone deployment, please refer to the deployment resource manual to modify config.yaml
cd /root/.elkeidup
## Generate hub only configurations
./elkeidup init --host {ip} --hub_only
mv config_example.yaml config.yaml
4、Deployment
cd /root/.elkeidup

# Command is interactive
./elkeidup deploy --hub_only

## status
./elkeidup status --hub_only

## undeploy
./elkeidup undeploy --hub_only
5、Visit the HUB front end
After a successful installation, executing cat /root/.elkeidup/elkeid_passwd will see the randomly generated passwords and associated URLs for each component.
| Field | Description |
|---|---|
| elkeid_hub_frontend | hub front-end account password |
| grafana | grafana account password |
| grafana | grafana address |
| elkeid_hub_frontend | elkeid hub front-end address |
| elkeid_service_discovery | Service Discovery Address |
To access elkeid_hub_frontend, refer to the Elkeid HUB Quick Start Tutorial.
6、HTTPS configuration
Please refer to Elkeid https configuration documentation
Resource Configuration of Elkeid Community Edition
Elkeid Architecture diagram
Note: Currently, Elkeid HUB's community version only supports stand-alone deployment

Components in detail
| Component name | Minimum deployment in the testing environment | Production environment | Listen ports | Description |
| Redis | single | Three, Sentry mode (only supports 3, larger clusters need to be replaced after deployment) |
|
cache database |
| MongoDB | single | Three replicas mode (only 3 are supported, larger clusters need to be replaced after deployment) |
|
db.table |
| Kafka | single | Calculated by the number of agents (only 3 units are supported in the case of automatic deployment, and multiple units need to be replaced after deployment) |
|
message channel |
| Nginx | single | Single or multiple units can be used. The download function is recommended to use internal CDN , if you need external access, it is recommended to use self-built LB |
|
File server and reverse proxy |
| Service Discovery | single | two to three |
|
Service Discovery |
| HUB | single | The community version only supports a single station (whether the production environment uses the community version, please conduct additional evaluation) |
|
rules engine |
| HUB Leader | single | The community version only supports a single station (whether the production environment uses the community version, please conduct additional evaluation) |
|
Rules engine Cluster control layer |
| HIDS Manager | single | two to three |
|
HIDS Control layer |
| Agent Center | single | Calculate by Agent quantity |
|
HIDS Access layer |
| Prometheus | single | Single or both |
|
Database for monitoring |
| Prometheus Alermanager | with Prometheus Shared server | - | ||
| Grafana | single | single |
|
monitoring panel |
| NodeExporter | No need to specify a separate server; all machines need to deploy the monitoring service | - |
|
monitoring probe |
| ProcessExporter | No need to specify separate a separate server, all machines need to deploy the monitoring service | - |
|
monitoring probe |
Configure Elkeidup
Notes for keywords:
- ssh_host is a generic configuration, indicating which machines the component is deployed on. If it is an array type, it means that the component supports Clustered Deployment. Otherwise, it only supports stand-alone deployment. See the configuration file notes for specific restrictions.
- Quotas are generic configurations that will eventually turn into cgroup limits.
- In a stand-alone testing environment, all machines can fill-in with the same address.
# Redis: Single or 3 hosts, 3 hosts infers it will be in Sentinel mode
redis:
  install: true
  quota: 1C2G
  ssh_host:
    - redis-1
    - redis-2
    - redis-3

# MongoDB: Single or 3 hosts, 3 hosts infers it will be in Replica-Set mode
mongodb:
  install: true
  quota: 2C4G
  ssh_host:
    - monogo-1
    - monogo-2
    - monogo-3

# Kafka: Single or 3 hosts, 3 hosts infers it will be in Cluster mode
kafka:
  install: true
  topic: hids_svr
  partition_num: 12 # Default partition number for one topic
  quota: 2C4G
  ssh_host:
    - kafka-1
    - kafka-2
    - kafka-3

# leader: The community edition currently only supports stand-alone mode
leader:
  install: true
  quota: 1C2G
  ssh_host: leader-1

# nginx: one or more hosts, but other components will only use the first one by default
nginx:
  install: true
  quota: 1C2G
  ssh_host:
    - nginx-1
    - nginx-2
  domain: # 指向nginx机器的域名,仅支持单个
  public_addr: # nginx机器的公网IP,仅支持单个

# sd: one or more hosts
service_discovery:
  install: true
  quota: 1C2G
  ssh_host:
    - sd-1
    - sd-2

# hub: The community edition currently only supports stand-alone mode
hub:
  install: true
  quota: 2C4G
  ssh_host: hub-1

# manager: one or more hosts
manager:
  install: true
  quota: 2C4G
  ssh_host:
    - manager-1

# ac: one or more hosts
agent_center:
  install: true
  grpc_conn_limit: 1500 # 单个AC的最大连接数限制
  quota: 1C2G
  ssh_host:
    - ac-1

# prometheus: one or two host, The second one will be used for double-write only.
prometheus:
  quota: 1C2G
  ssh_host:
    - prometheus-1

# grafana: one host only
grafana:
  quota: 1C2G
  ssh_host: grafana-1
Build Elkeid CWPP from Source Code
In the current community version, some components have not been open sourced. Mainly, the related components of Elkeidup and Hub can only provide community version binaries at present, so it cannot provide a build manual built entirely from source code from zero to one. You can run the executable program built from source code by replacing the specified files in the package before installation, or replacing the executable program after installation. The specific file locations and corresponding relationships are described below.
Replace before installation
Agent
The Agent part will be built from the source code during the elkeidup deploy process, so the following files in the package can be replaced. It is recommended to unzip the file and confirm that the file and directory structure are the same as the files before replacement.
package/agent/v1.9.1/agent/elkeid-agent-src_1.7.0.24.tar.gz
Driver Plugin
The Driver plugin will also build from the source code during the elkeidup deploy process, so you can also replace the following files in the package. It is recommended to unzip the file and confirm that the file and directory structure are the same as the files before replacement.
package/agent/v1.9.1/driver/driver-src_1.0.0.15.tar.gz
Other agent plugins
Other agent plugins are pre-compiled. According to the documentation of each plugin, replace the corresponding files after compiling. Note that the plugin has plg format and tar.gz format. The plg format is an executable file, and the tar.gz is a compressed packet. The version number is currently hard coding in elkeidup, which needs to be consistent, please do not change it.
package/agent/v1.9.1/driver/driver-src_1.0.0.15.tar.gz
package/agent/v1.9.1/baseline/baseline-default-aarch64-1.0.1.23.tar.gz
package/agent/v1.9.1/baseline/baseline-default-x86_64-1.0.1.23.tar.gz
package/agent/v1.9.1/collector/collector-default-aarch64-1.0.0.140.plg
package/agent/v1.9.1/collector/collector-default-x86_64-1.0.0.140.plg
package/agent/v1.9.1/etrace/etrace-default-x86_64-1.0.0.92.tar.gz
package/agent/v1.9.1/journal_watcher/journal_watcher-default-aarch64-1.0.0.23.plg
package/agent/v1.9.1/journal_watcher/journal_watcher-default-x86_64-1.0.0.23.plg
package/agent/v1.9.1/rasp/rasp-default-x86_64-1.9.1.44.tar.gz
package/agent/v1.9.1/scanner/scanner-default-aarch64-3.1.9.6.tar.gz
package/agent/v1.9.1/scanner/scanner-default-x86_64-3.1.9.6.tar.gz
ko
When deploying by default, the pre-compiled ko will not be copied to nginx. The pre-compiled ko will be provided in the release interface at the same time. After downloading the pre-compiled ko or compiling ko by yourself, you can replace the following files. The file is in tar.xz format. There is a ko folder after decompression, the format must be the same.
package/to_upload/agent/component/driver/ko.tar.xz
Manager & ServiceDiscovery & AgentCenter
Compile the corresponding binary, decompress the tar.gz of the following path, and then replace the binary and pack it back to tar.gz.
# manager
package/manager/bin.tar.gz
# service discovery
package/service_discovery/bin.tar.gz
# agent center
package/agent_center/bin.tar.gz
Replace after installation
Agent related
The agent part can be uploaded through the front end, see the agent release document for details
ko
Copy the corresponding ko and sing files to the following directory, and then execute the command to modify the directory permissions
# ko directory
/elkeid/nginx/ElkeidAgent/agent/component/driver/ko

# Modify permissions
chown -R nginx: nginx /elkeid/nginx
Manager & ServiceDiscovery & AgentCenter
Pause the service, replace the corresponding binary, and restart the service
#manager
systemctl stop elkeid_manager
mv new_manager_bin /elkeid/manager/manager
systemctl start elkeid_manager

#service discovery
systemctl stop elkeid_sd
mv new_sd_bin /elkeid/service_discovery/sd
systemctl start elkeid_sd

#agent center
systemctl stop elkeid_ac
mv new_ac_bin /elkeid/agent_center/agent_center
systemctl start elkeid_ac
Elkeidup Community Edition Upgrade Guide 1.7.1 -- > 1.9.1
Foreword
First you need to configure elkeidup 1.7.1 to coexist with version 1.9.1, and then switch as the case may be.
For detailed operation, please refer to the documentation of 1.7.1 and 1.9.1 at the same time.
# rename .elkeidup dir
cd /root
mv .elkeidup .elkeidup_v1.7.1
ln -s .elkeidup_v1.7.1 .elkeidup

# copy cert to v1.9.1
mkdir -p /root/.elkeidup_v1.9.1
cp -r /root/.elkeidup_v1.7.1/elkeid_password /root/.elkeidup_v1.9.1
cp -r /root/.elkeidup_v1.7.1/cert /root/.elkeidup_v1.9.1
# download v1.9.1 package to /root/.elkeidup_v1.9.1
Switch to 1.7.1
rm /root/.elkeidup && ln -s /root/.elkeidup_v1.7.1 /root/.elkeidup
Switch to 1.9.1
rm /root/.elkeidup && ln -s /root/.elkeidup_v1.9.1 /root/.elkeidup
Backend
The v1.9.1 backend is currently not compatible with v1.7.1, you need to uninstall the v1.7.1 backend and reinstall v1.9.1.
backup data
Select backup data as needed:
- Backup MongoDB: The directory is located /elkeid/mongodb is only a backup DB, and the backed up data cannot be used directly. If there is a recovery need, there is no automated script at present, and manual conversion is required.
- Backup Hub Policies: The directory is located /elkeid/hub Policies can be imported in the Hub web interface.
uninstall v1.7.1
After uninstalling the v1.7.1 backend, Agent will automatically close all plugins after 1 minute and enter the daemon state until the new backend is installed
#switch to v1.7.1 according to the preface

cd /root/.elkeidup
./elkeidup undeploy
install v1.9.1
After installing the v1.9.1 backend, the Agent will be reconnected within 1min, but no plugins have been loaded at this time, you can see this state on the Console
#switch to v1.9.1 according to the preface
#For installation documentation, see v1.9.1 installation documentation
cd /root/.elkeidup
./elkeidup deploy
Agent
Confirm configuration and state
-
'/root/elkeidup_v1/cert'/root/elkeidup_v1/cert 'The contents of all files in the three directories are consistent
-
'/root/elkeidup_v1/elkeid_server.yaml'/root/elkeidup_v1/elkeidup_config.yaml 'The following related configurations are consistent.
-
Note: The filed value of the specific field is subject to'v1.9.1 ', please do not directly cover.
-
nginx
- domain
- ssh_host
- public_addr
-
mg
- ssh_host
-
-
After confirming that the backend update is complete, all v1.7.1 Agents have been successfully launched
Build v1.9.1 component
./elkeidup agent init
./elkeidup agent build
./elkeidup agent policy created
Submit a task
Grey release upgrade can be performed as needed. At this time, the newly launched/reconnected client/client side/client end will automatically pull the latest configuration upgrade, and other client/client side/client ends need to manually sync up configuration upgrade
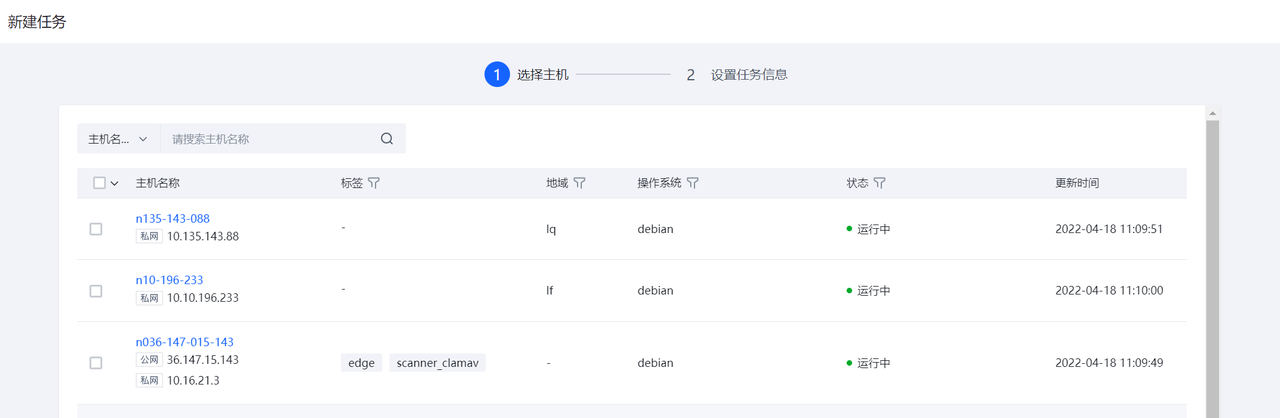
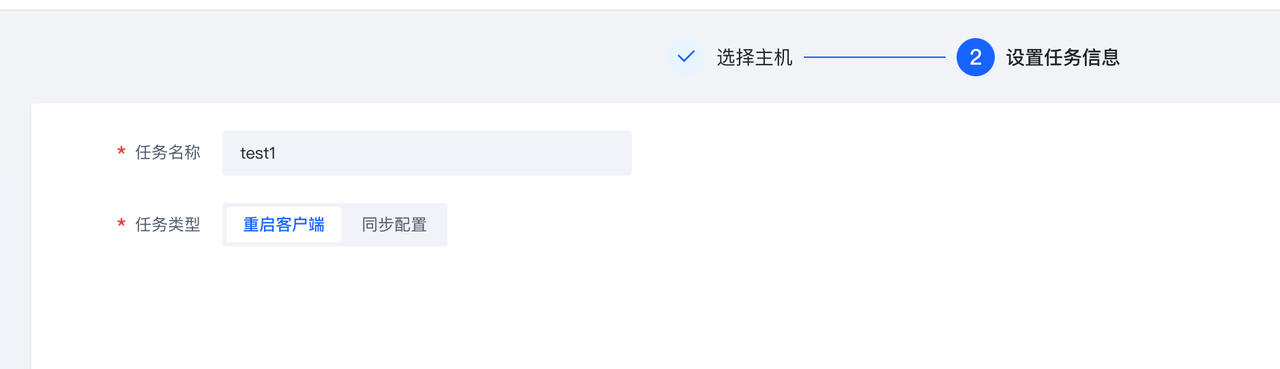
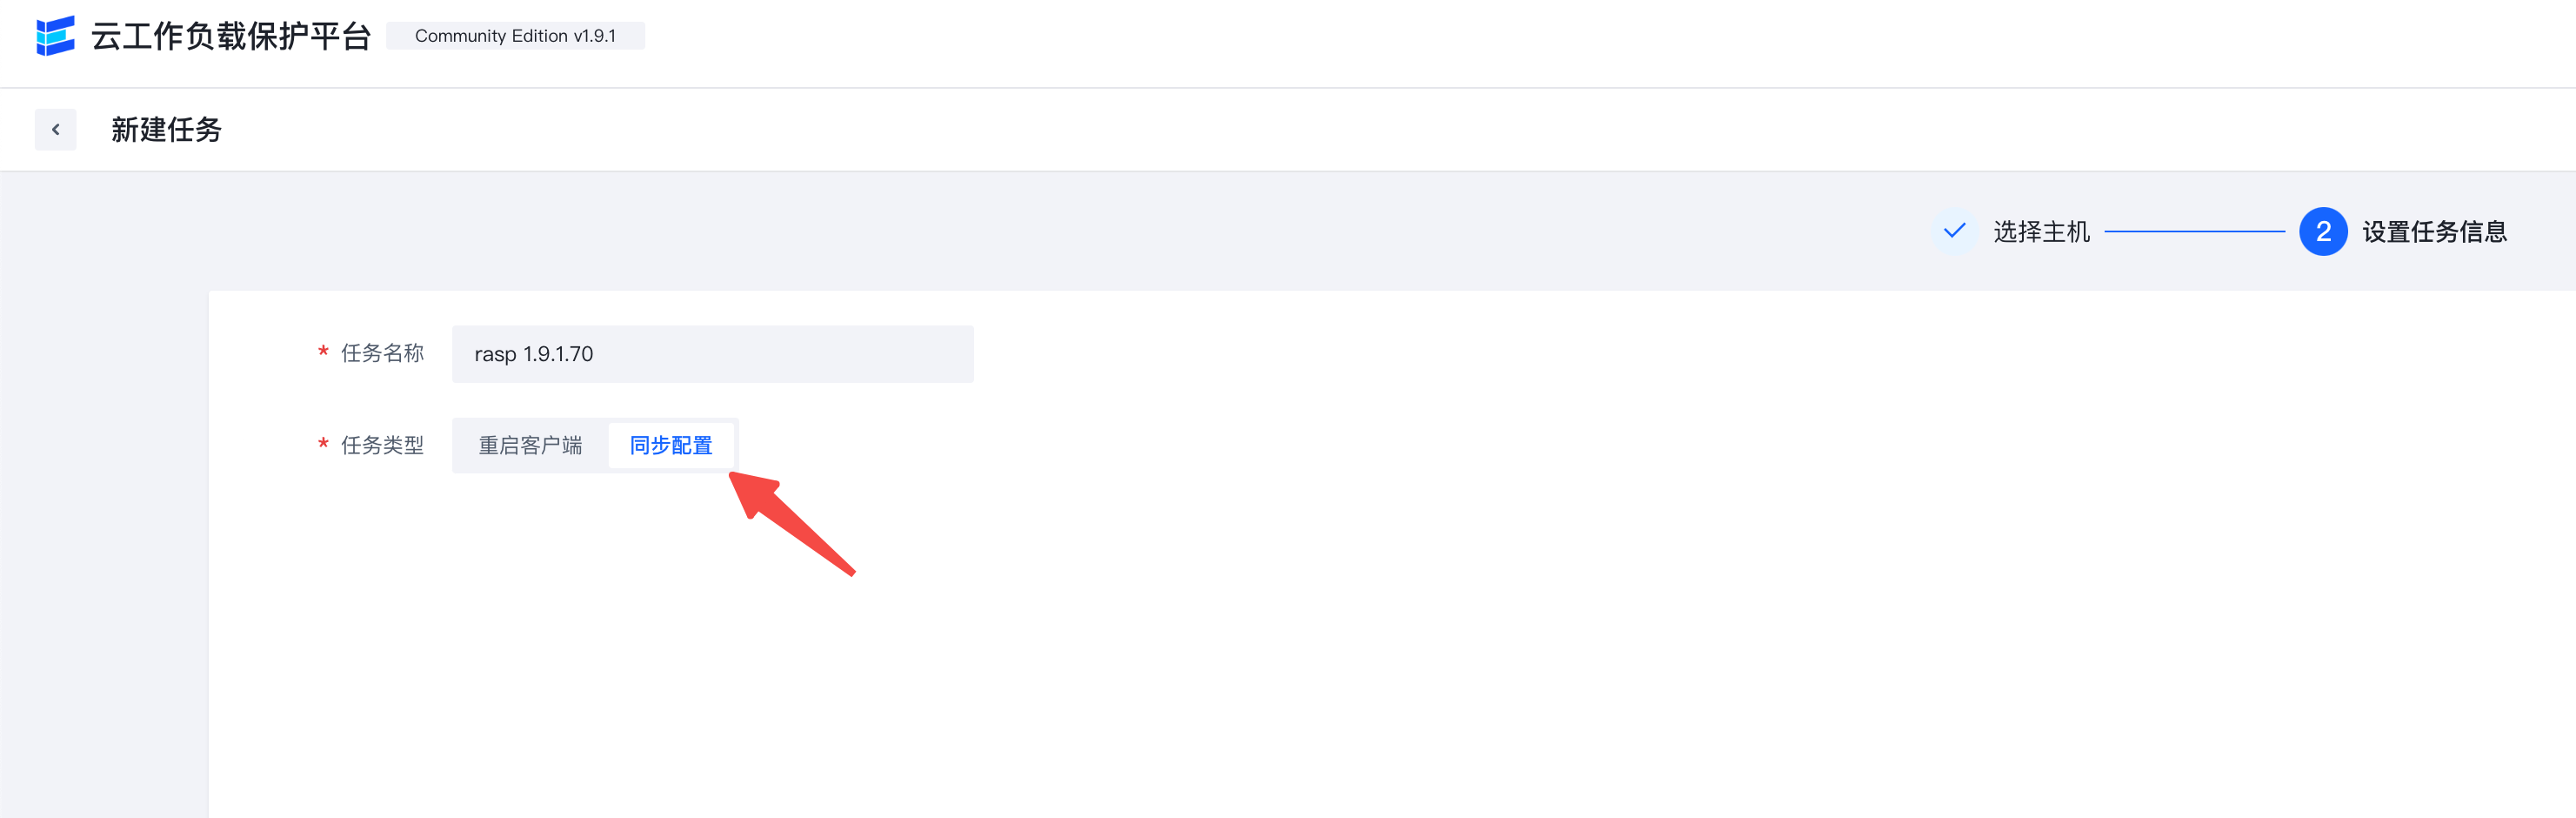
- In the Elkeid Console - Task Management interface, click "New Task", select a single host, click Next, select the "sync up configuration" task type, and click Confirm. Then, find the task you just created on this page, click Run, and observe whether the upgraded host meets expectations.
- In the Elkeid Console - Task Management interface, click "New Task", select all hosts, click Next, select "sync up configuration" task type, and click Confirm. Then, find the task you just created on this page and click Run to upgrade the old version of Agent.
Elkeid Community Edition, Expansion Guide
ServiceDiscovery
Self-expansion (dependency elkeidup)
- Modify config.yaml add other hosts in sd, and the login conditions are the same as when installing.
- Execute the following command elkeidup reinstall --component ServiceDiscovery --re-init
Self-expansion (manual operation)
- Copy the /elkeid/service_discovery of the installed SD machine to the machine to be expanded.
- Update all SD configuration file /elkeid/service_discovery/conf/conf.yaml Cluster. Members item, which is an array of all SD instances, and each SD must fill in the addresses of all instances.
- Execute the /elkeid/service_discovery/install.sh of the new SD instance, which will automatically start SD.
- Restart all old sd instances'systemctl restart elkeid_sd '.
sync up the upstream and downstream configuration
SD is currently a dependency of AgentCenter, Manager and Nginx. After expanding SD, you need to sync up and restart.
- AgentCenter: The configuration file is located sd.addrs/elkeid/agent_center/conf/svr.yml, restart the command'systemctl restart elkeid_ac '.
- Manager: configuration file is sd.addrs/elkeid/manager/conf/svr.yml, restart command'systemctl restart elkeid_manager '.
- Nginx: configuration file is located in the upstream sd_list of/elkeid/nginx/nginx/nginx.conf, restart command'systemctl restart elkeid_nginx '.
AgentCenter
Self-expansion (dependency elkeidup)
- Modify config.yaml add other hosts in ac, and the login conditions are the same as when installing.
- Execute the following command elkeidup reinstall --component AgentCenter --re-init
Self-expansion (manual operation)
- Copy the /elkeid/agent_center of the installed AC machine to the machine to be expanded.
- Executing the /elkeid/agent_center/install.sh of the new AC instance installs and starts AC automatically.
sync up the upstream and downstream configuration
If the agent is linked to the AC by means of service discovery, there is no need to manually sync up the upstream and downstream configurations.
If the agent is linkage AC through the AC address of the code, you need to re-compile the agent and add the new AC address to the agent linkage configuration.
Elkeid https configuration documentation
1. Overview
- By default, the Elkeid Console listens on ports 8082 and 8072, and the Elkeid HUB listens on ports 8081 and 8071.
- If HTTPS is required, ports 8072 and 8071 can be used for access.
| Elkeid Console | Elkeid HUB Console | |
|---|---|---|
| HTTP | http://{{NignxIP}}:8082 | http://{{NignxIP}}:8081 |
| HTTPS | https://{{NignxIP}}:8072 | https://{{NignxIP}}:8072 |
2. Use an internal enterprise certificate
The self-signed certificate generated during installation is located in the '/elkeid/nginx/nginx' directory on the machine where nginx is located, and includes the following two files:
server.key
server.crt
After replacing the above two files, do the following:
chown -R nginx: nginx /elkeid/nginx
systemctl restart elkeid_nginx
3. Use the self-signed certificate generated at deployment time
When Elkeid is deployed, it can only use a self-signed certificate. Due to the security settings of chrome, it cannot be accessed directly. All you need to manually trust the certificate to access it using https. The specific operation is as follows:
The following example hypotheses that the server where nginx is located is console.elkeid.org and has a configuration of /etc/hosts or dns parsing.
3.1, Macos
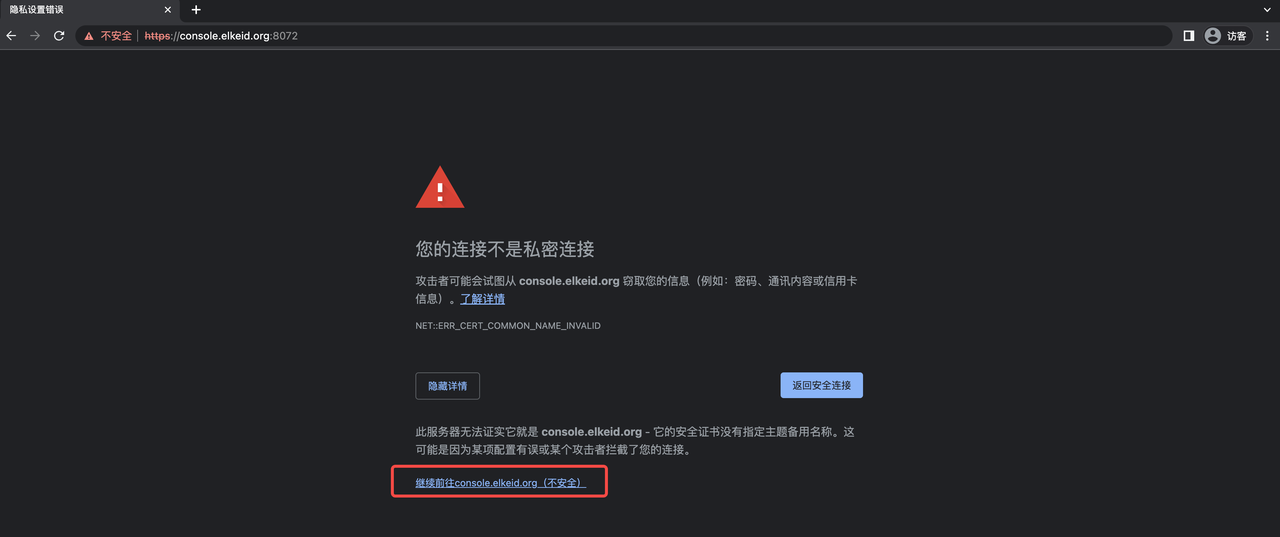
- Access https://console.elkeid.org:8072/ Export Certificate
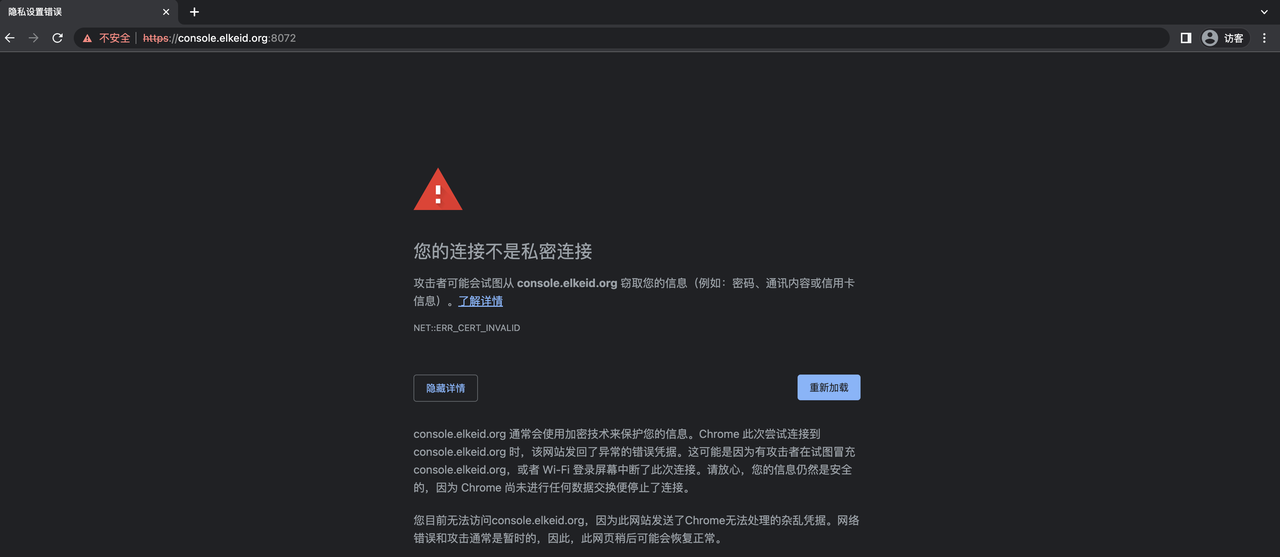
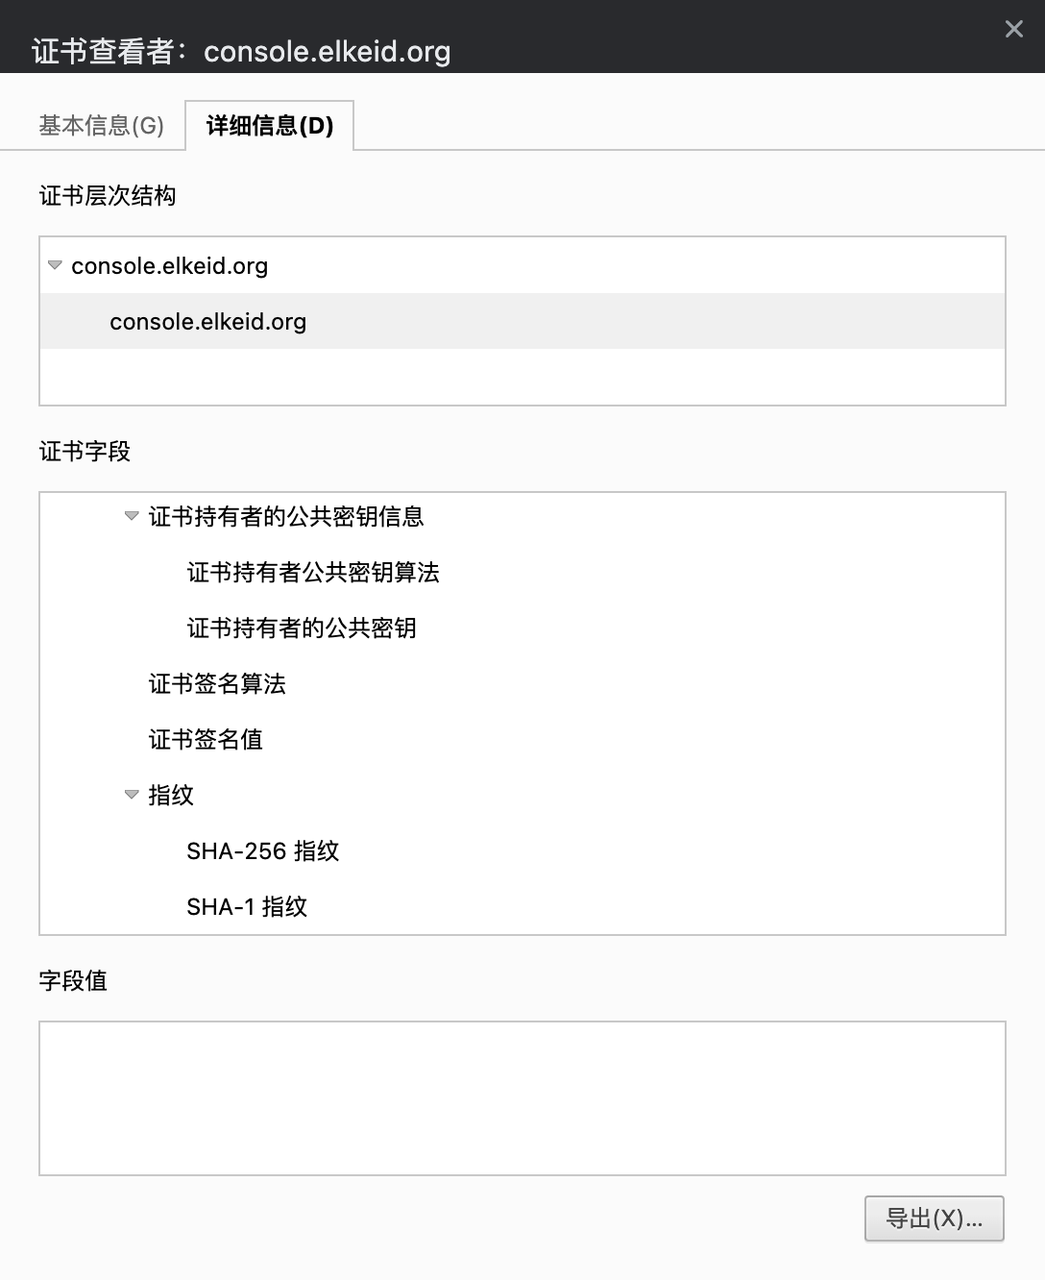
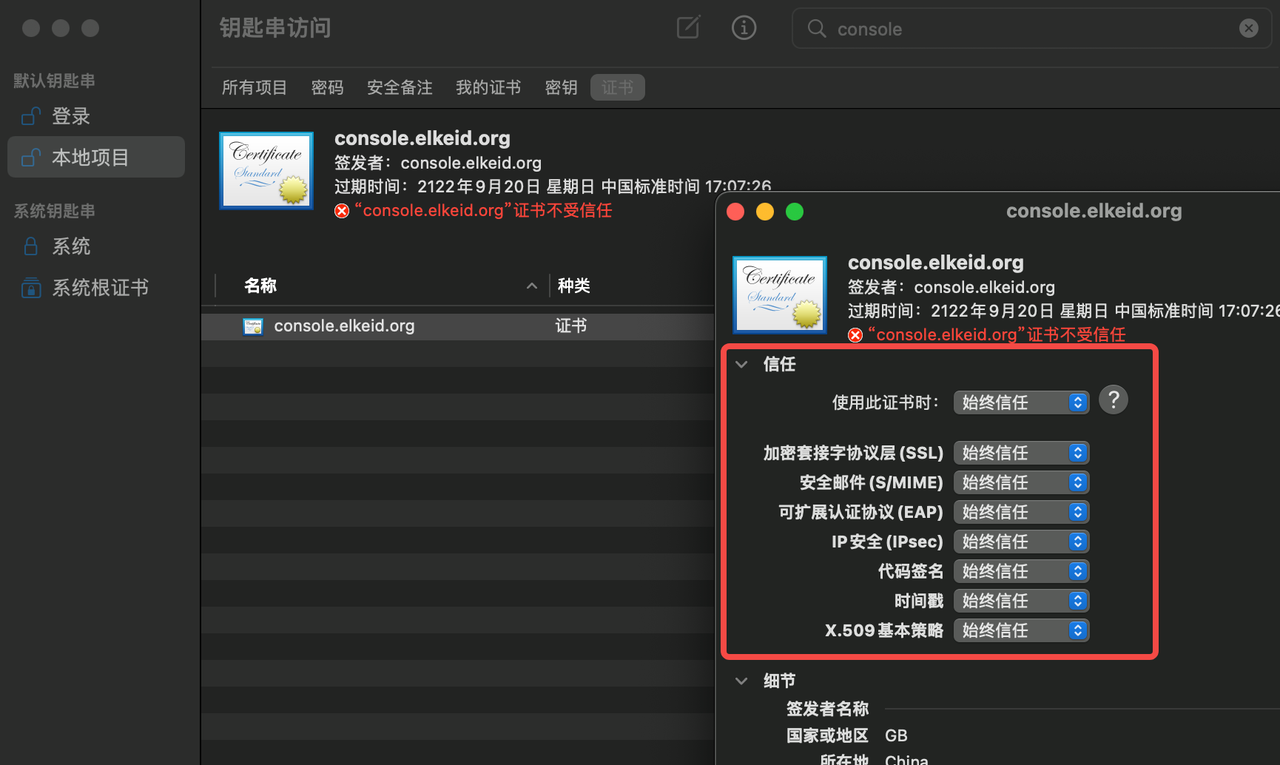
- Import the exported certificate and trust it
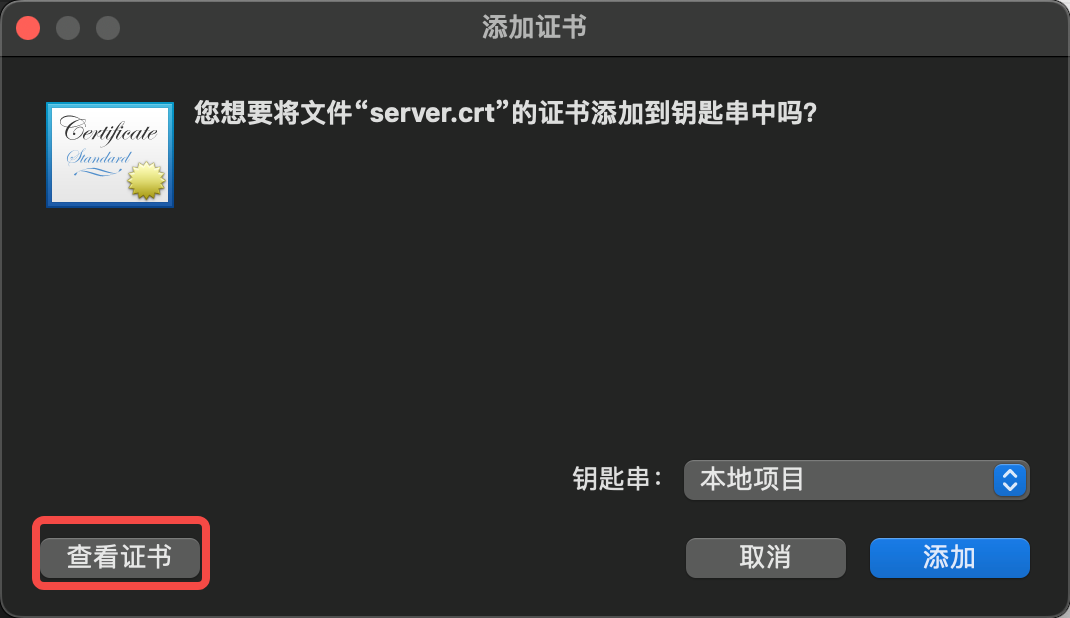
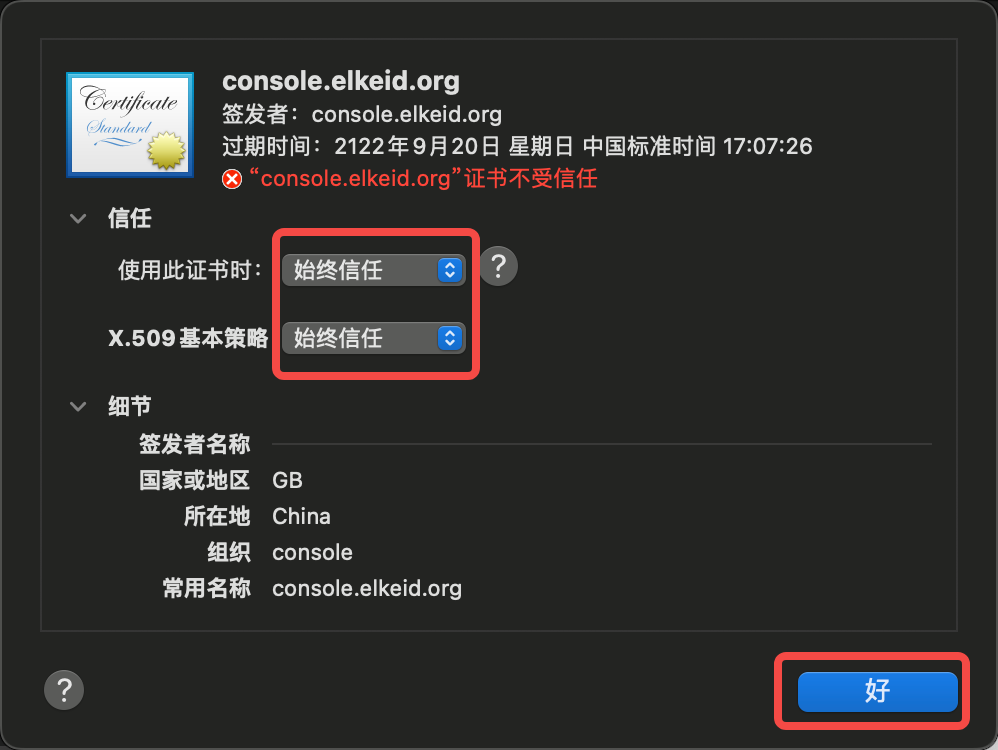
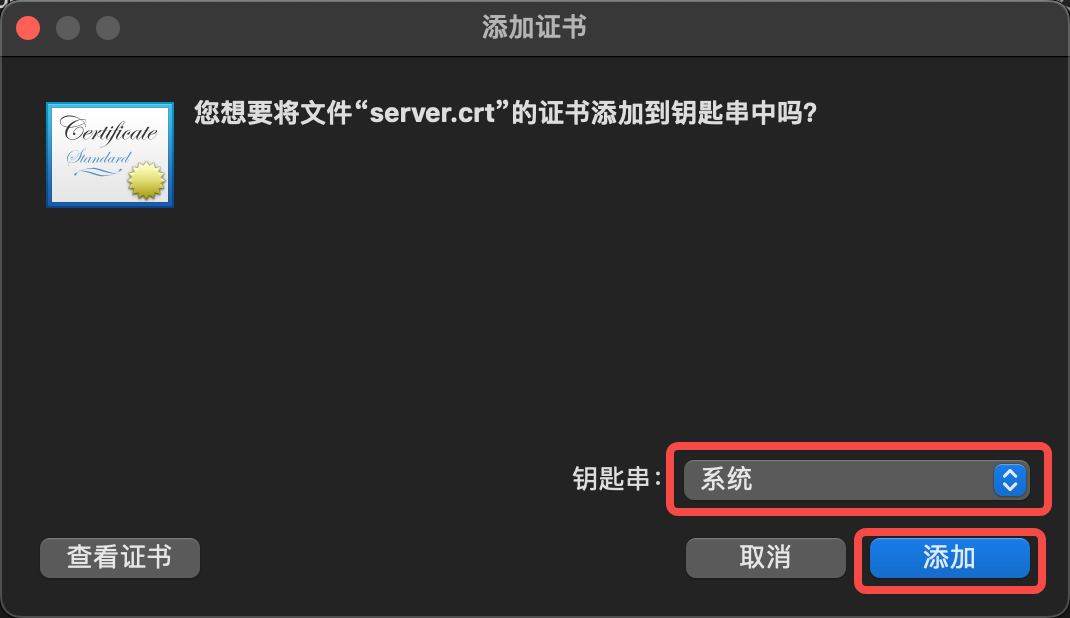
- Click Keychain Access, Trust Certificate
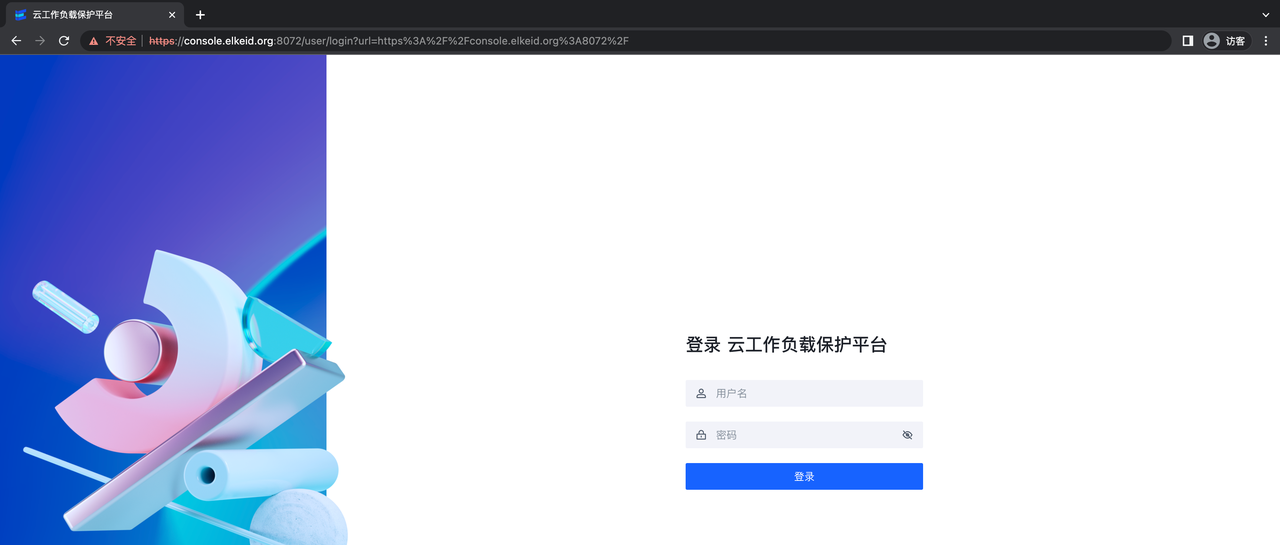
- Visit https://console.elkeid.org:8072/ again
Elkeid Console 主机安全保护平台使用手册
版本
社区版v1.9.1
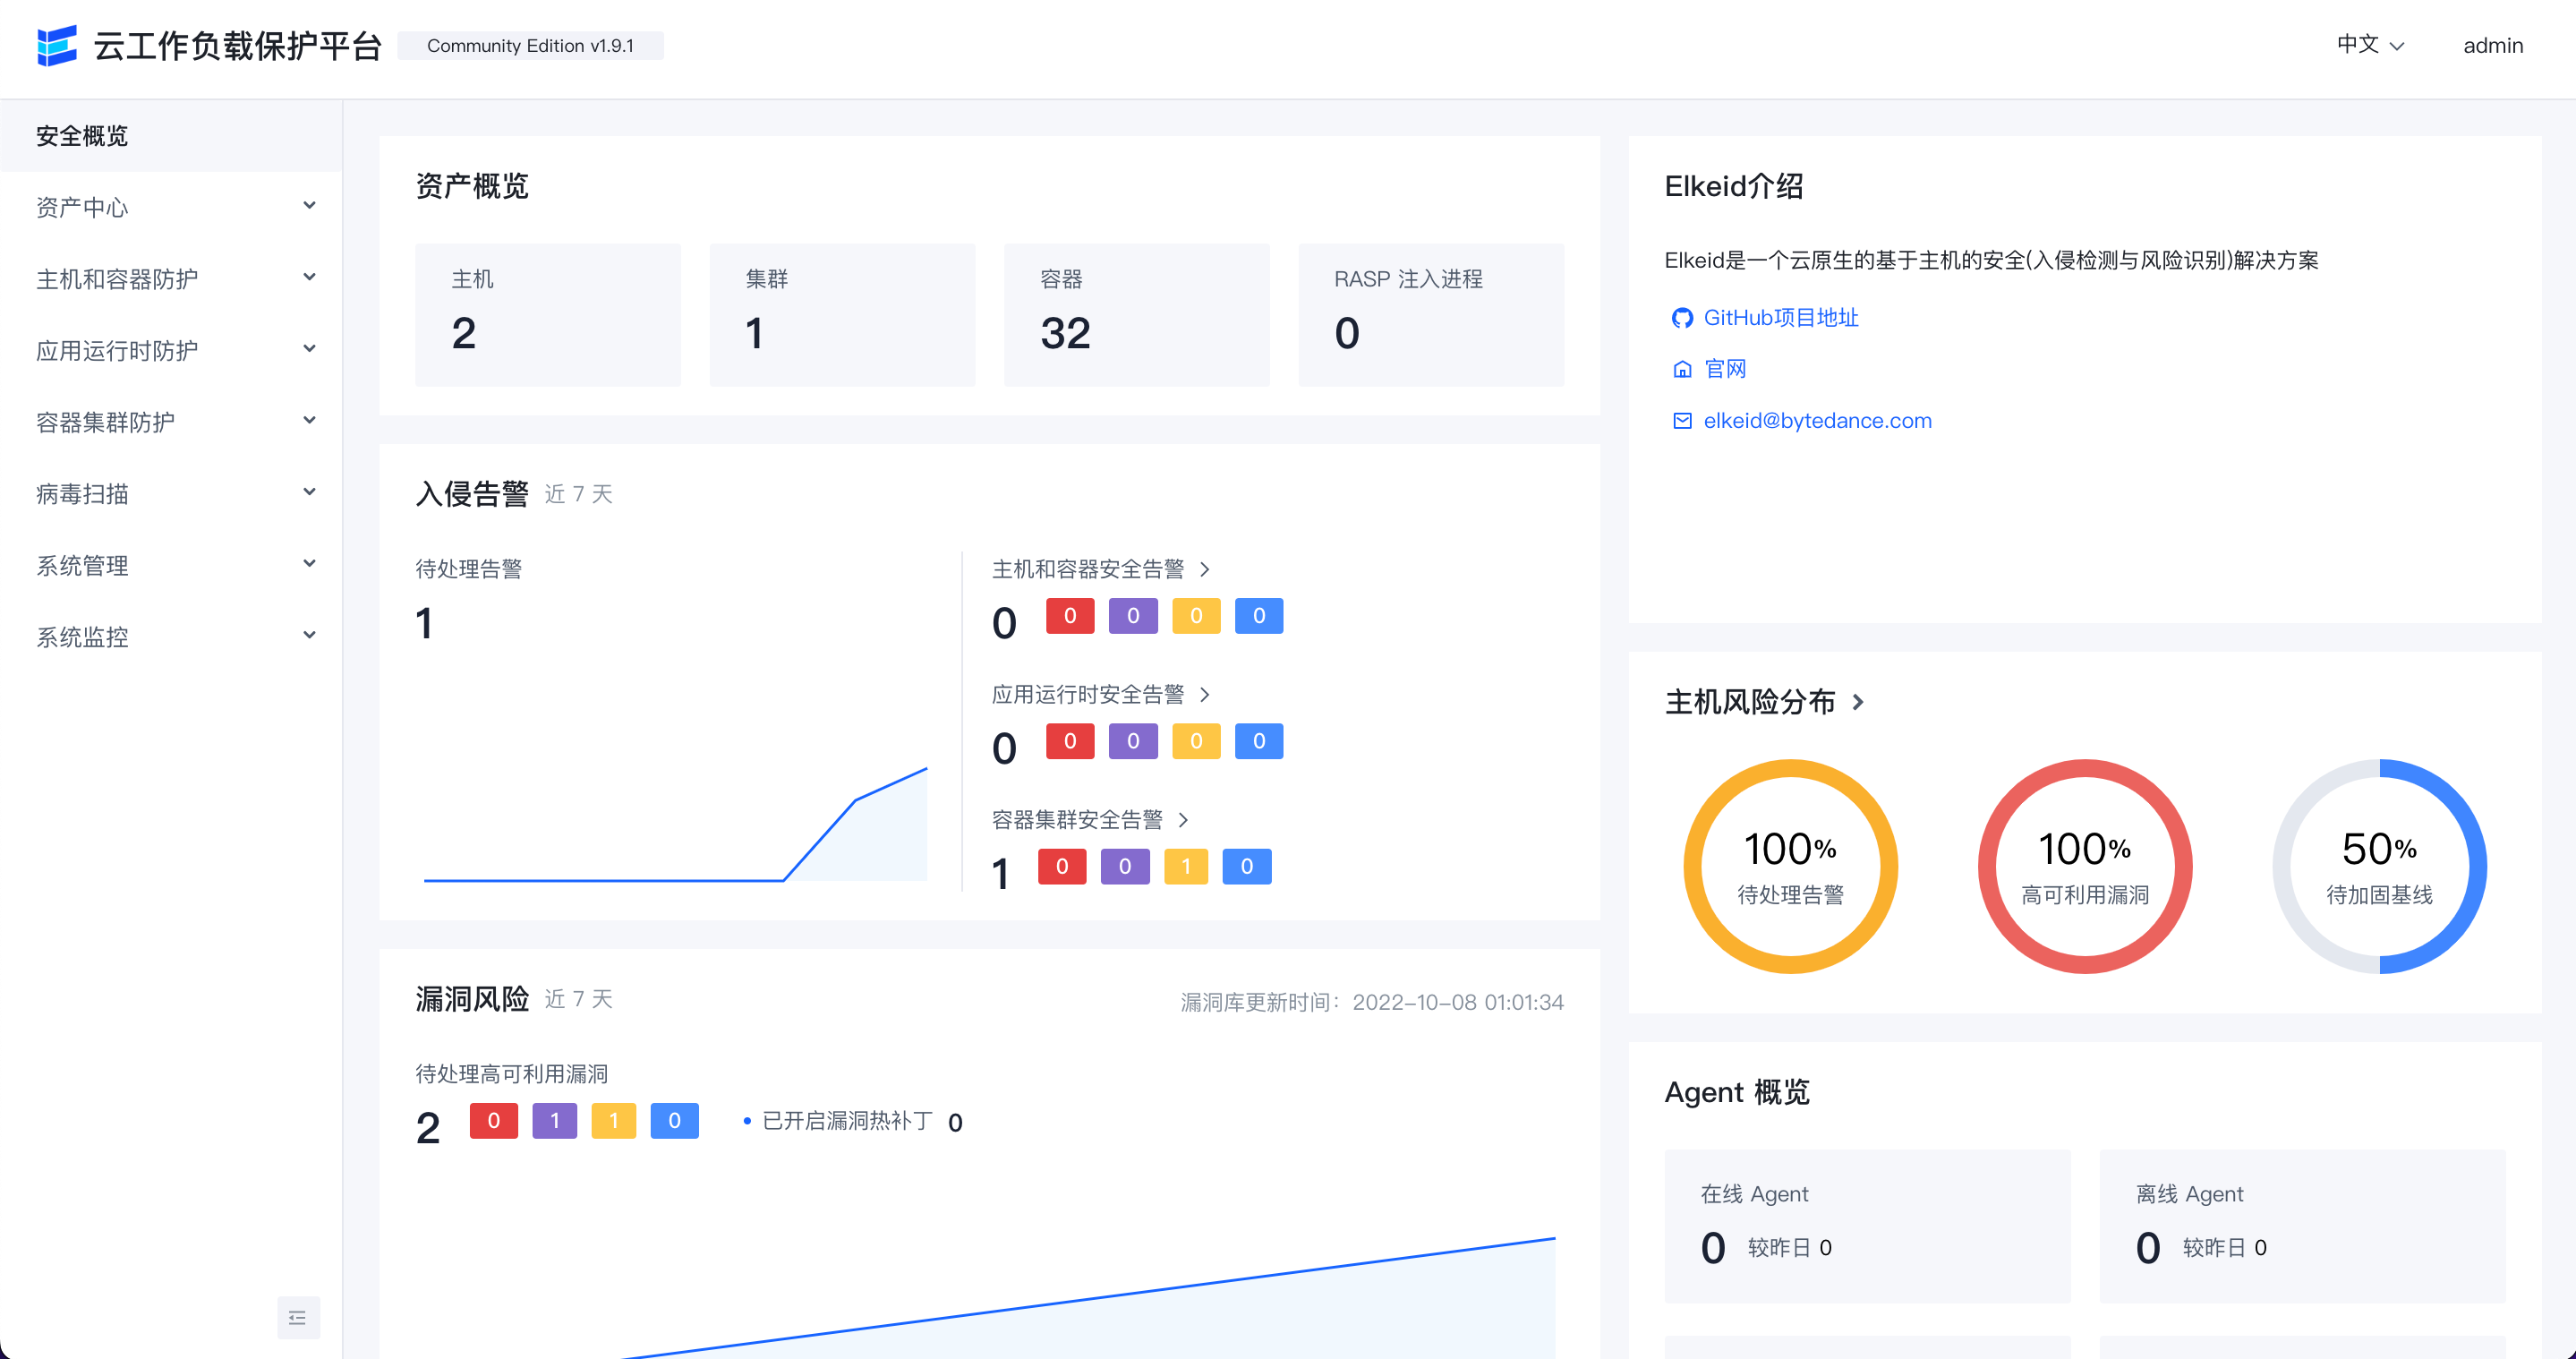
安全概览
通过安全概览能快速了解覆盖范围,告警势态,运营情况(安全告警与安全风险处置情况)等的整体安全态势。
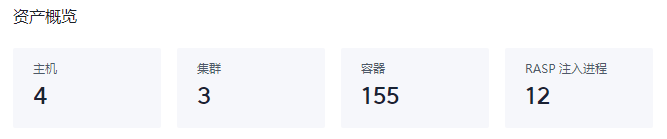
资产概览
查看当前在覆盖的主机和容器集群信息。
入侵告警
展示未处理告警的数量以及最近7天内的变化趋势。

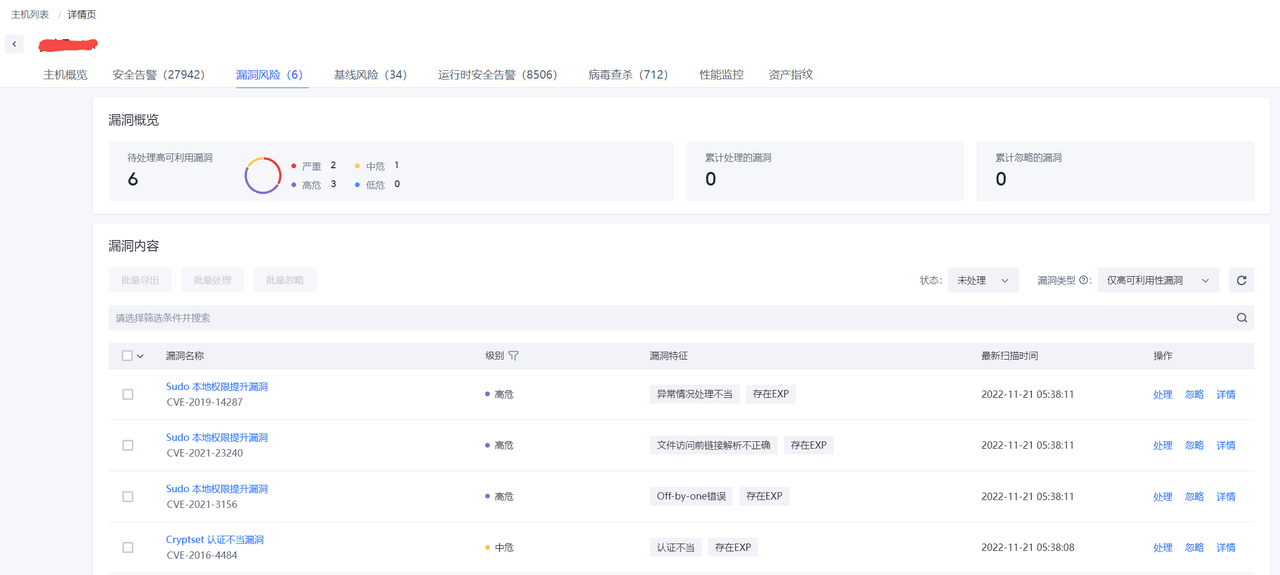
漏洞风险
展示未处理漏洞的数量以及最近7天内的变化趋势。

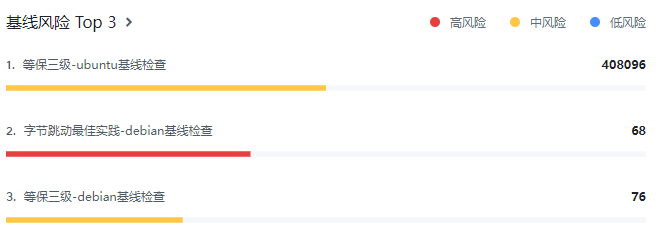
基线风险
展示TOP3的基线风险数量。
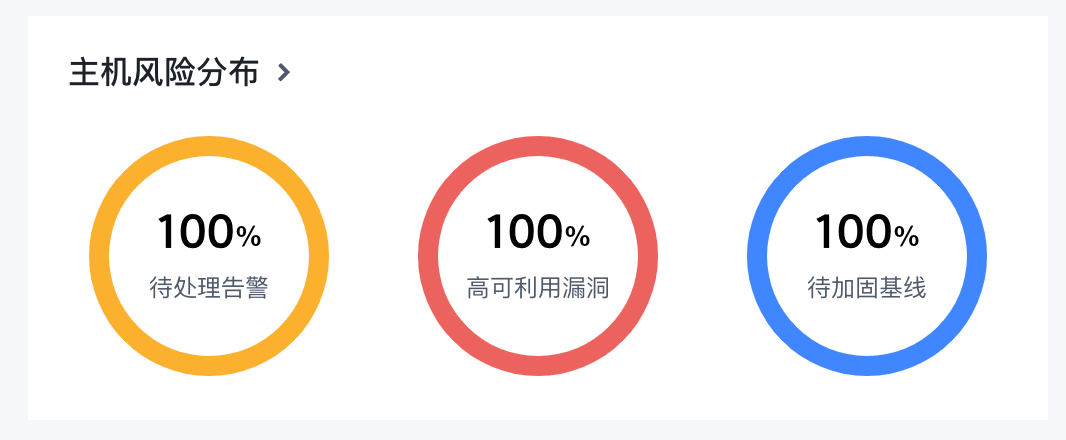
主机风险分布
展示当前存在待处理告警、高可利用漏洞和基线风险的主机占比。
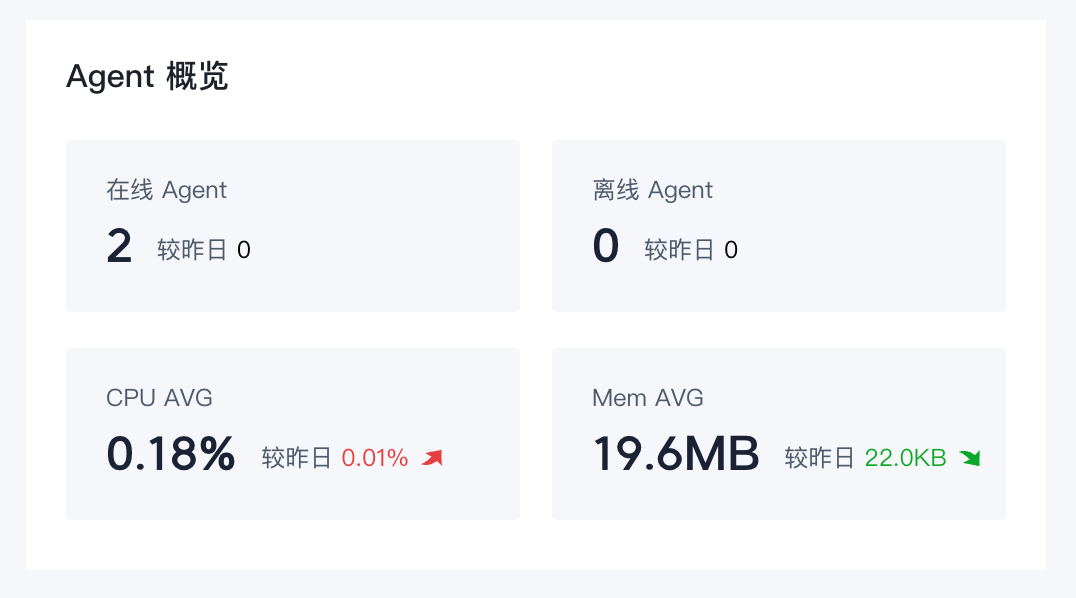
Agent 概览
展示Agent的在线情况和资源占用情况。
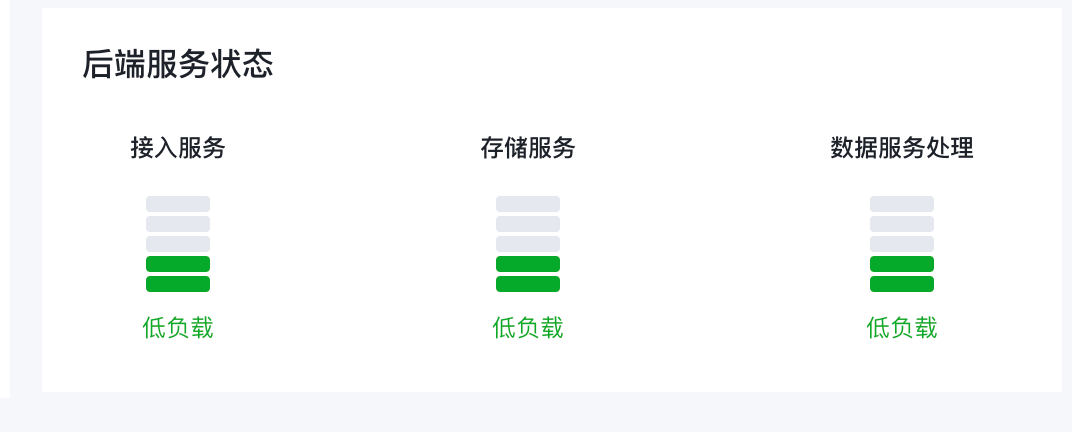
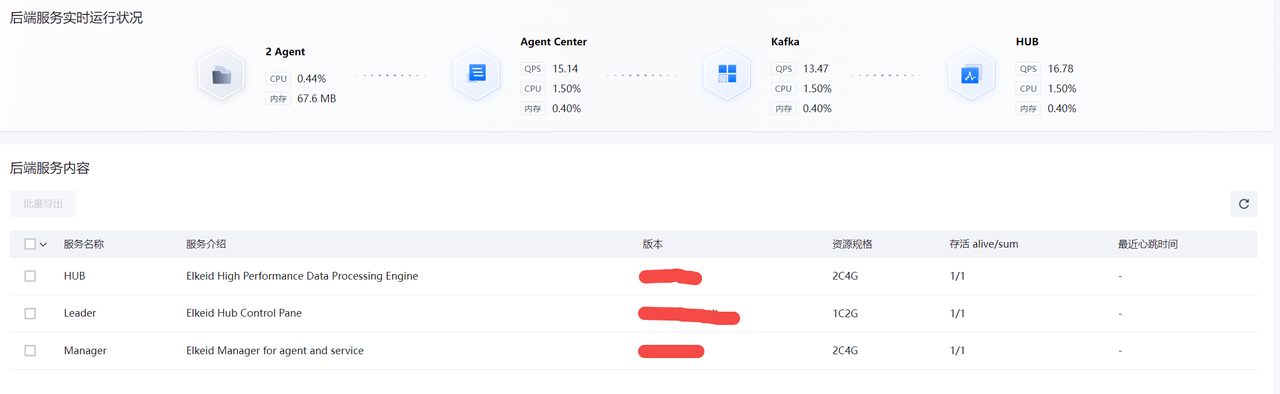
后端服务状态
展示后端服务的负载。
资产中心
运营人员可以通过资产中心对资产数,Agent运行情况,资产上详细信息进行查看。
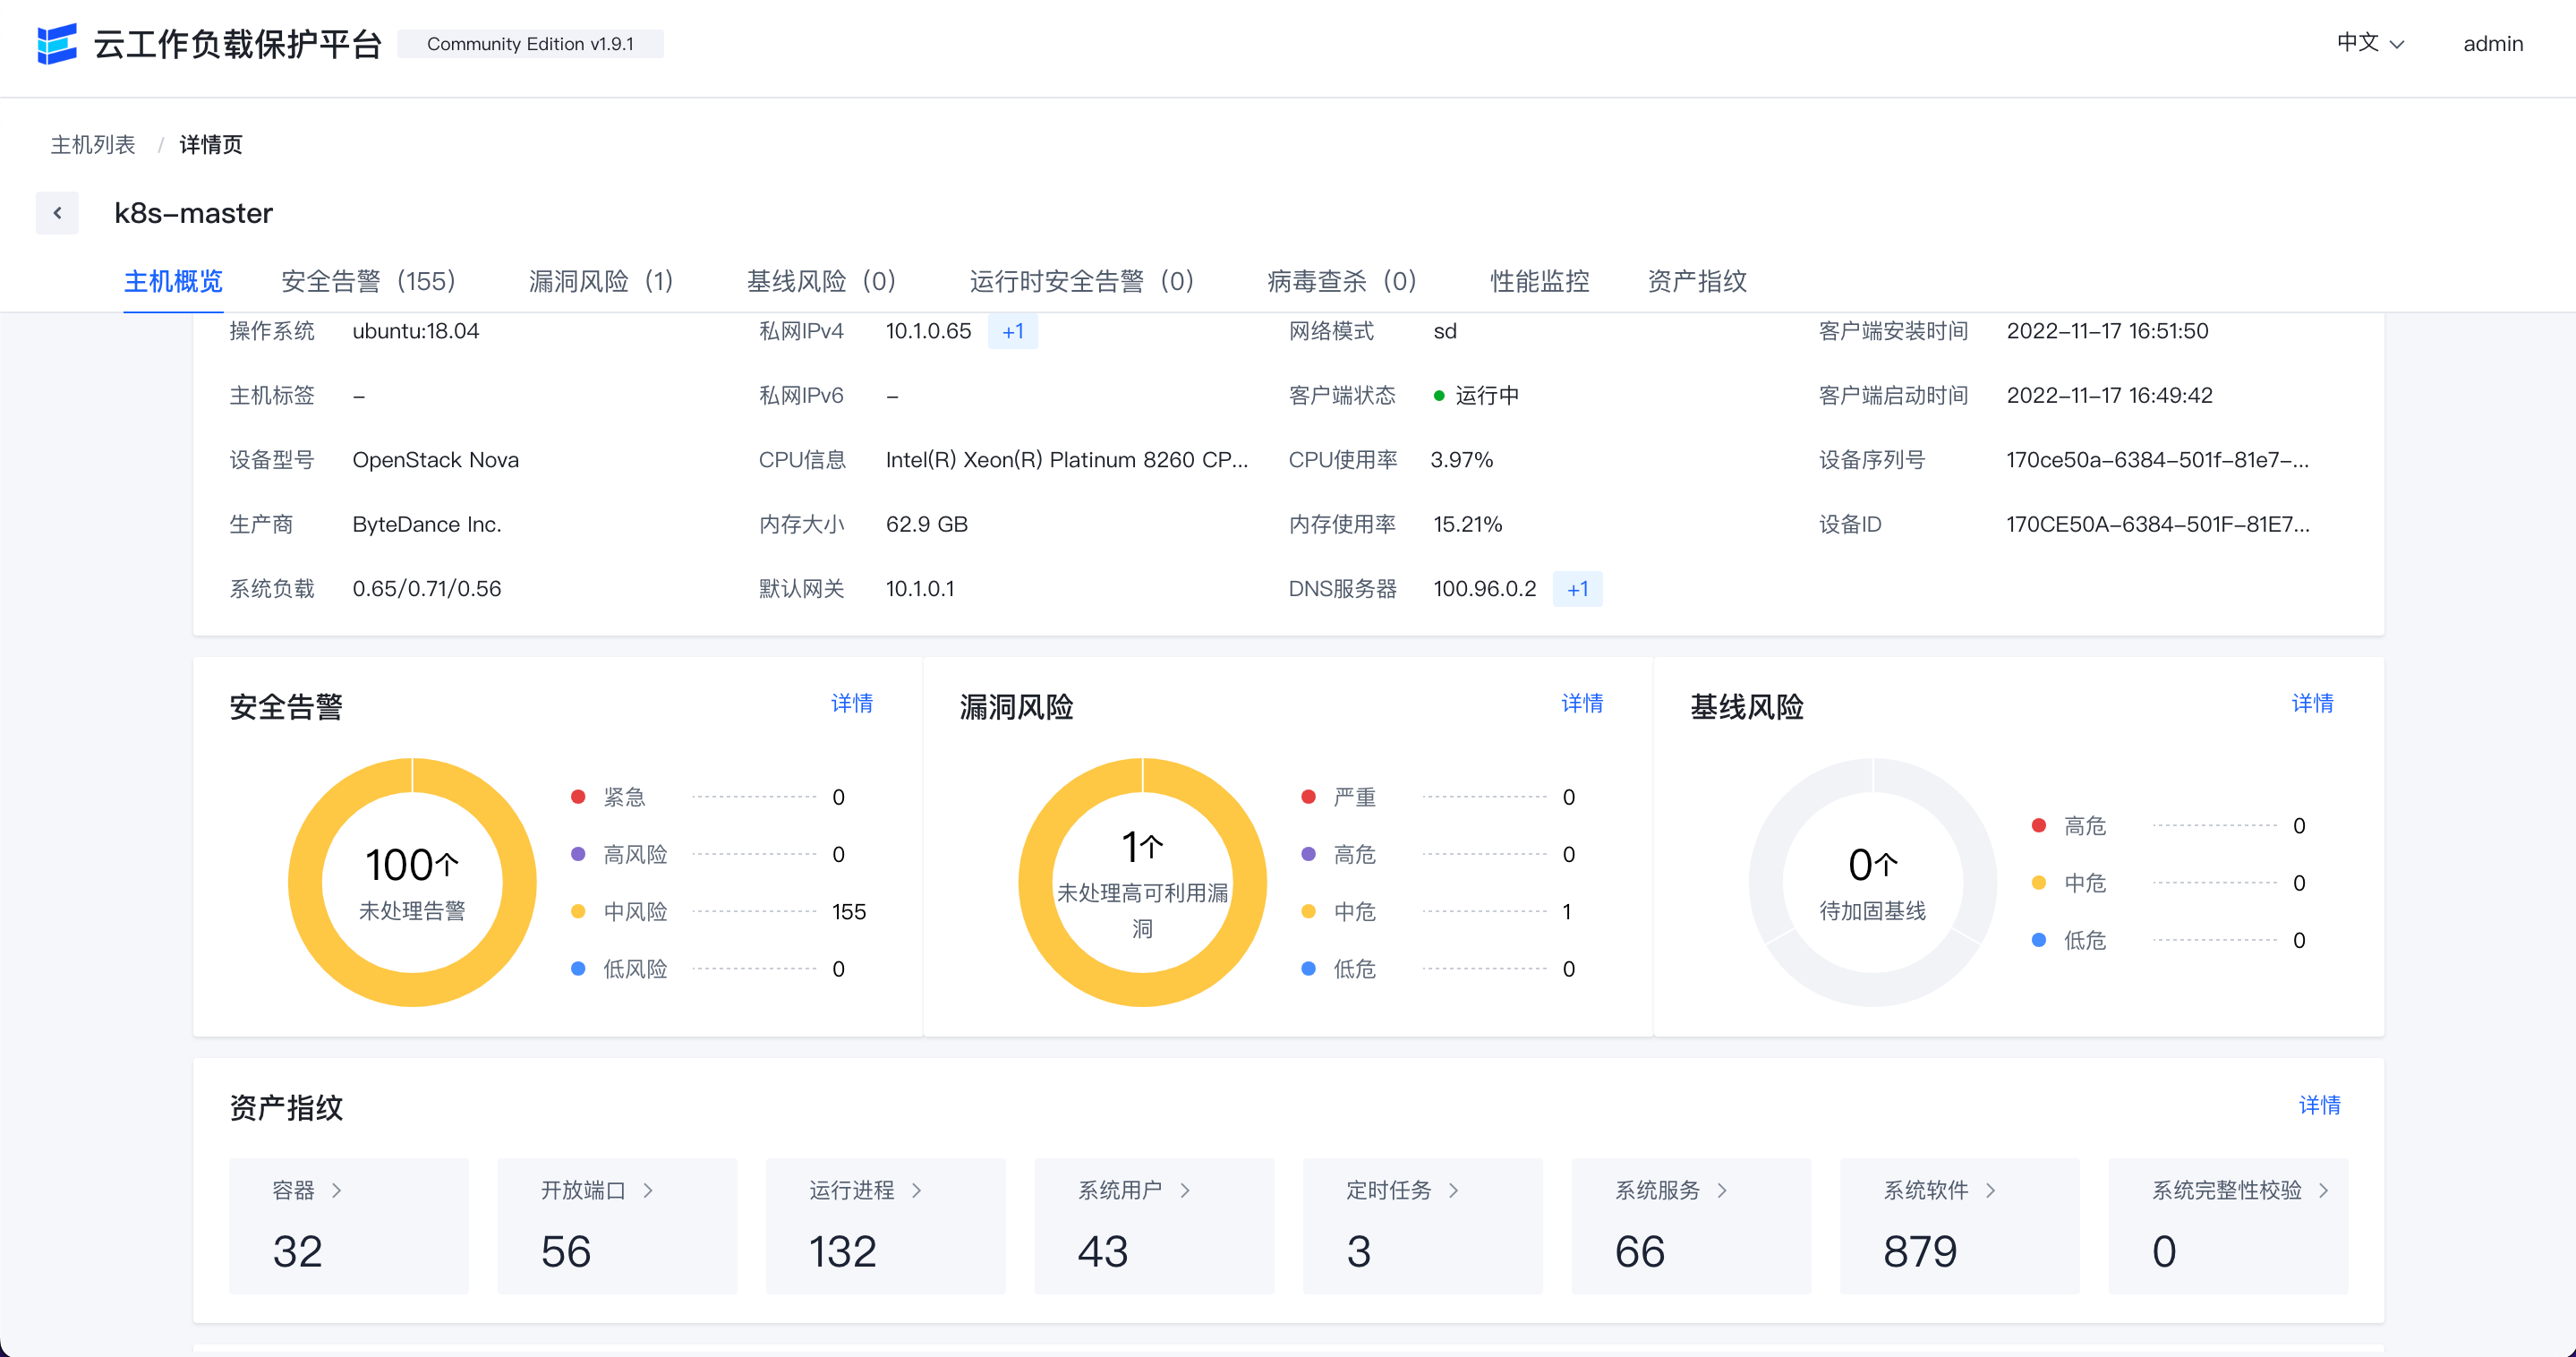
主机列表
展示主机资产的列表以及各主机的风险情况。
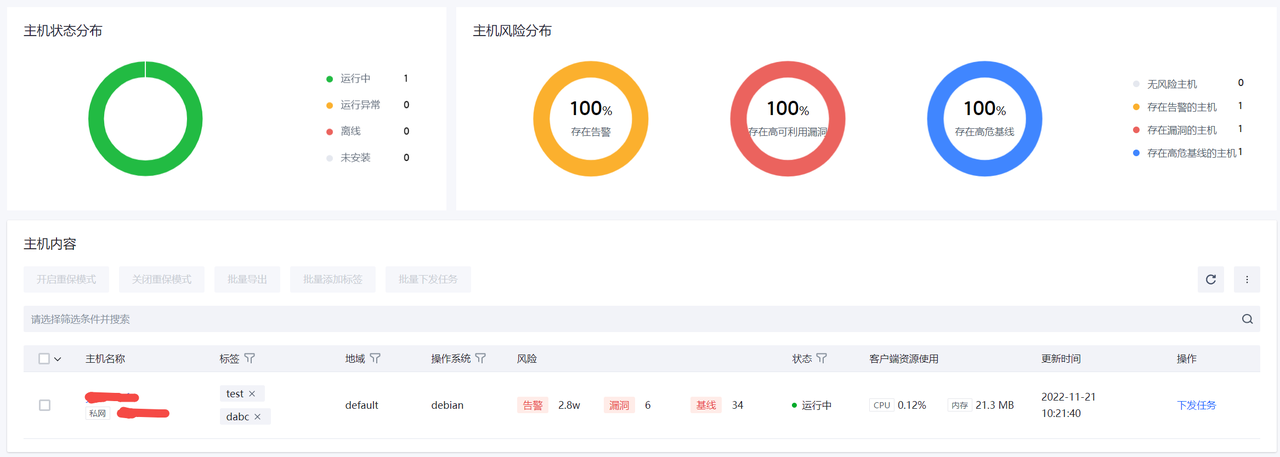
点击"主机名称"可以进入查看此主机的资产信息和风险信息。
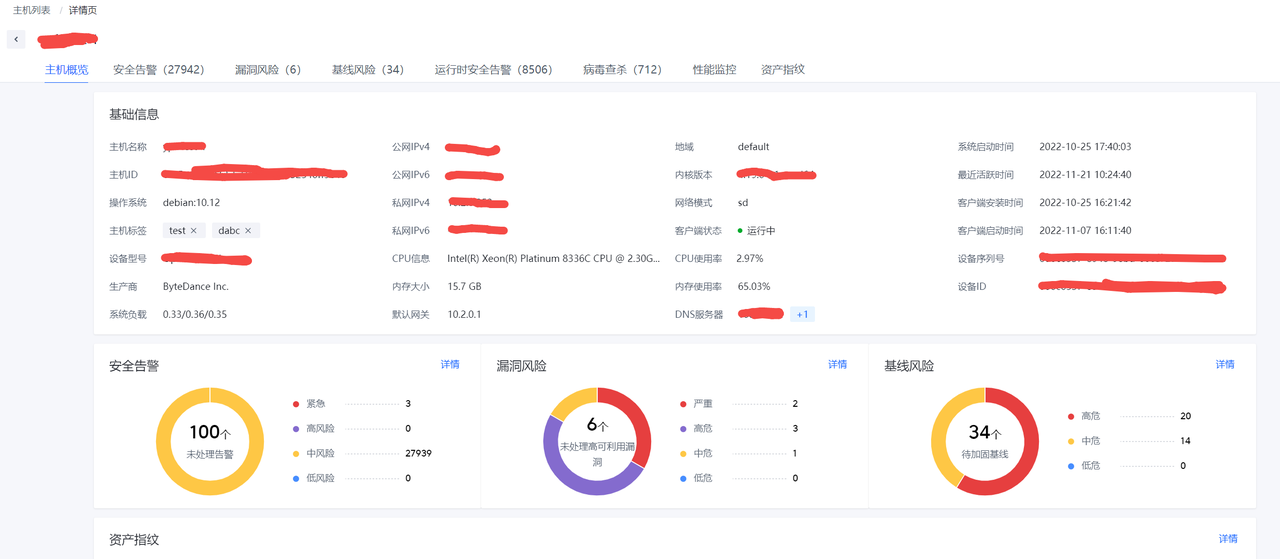
点击页面中各标签可以查看主机各类相关数据,目前支持下列数据。
- 安全告警
- 漏洞风险
- 基线风险
- 运行时安全告警
- 病毒查杀
- 性能监控
- 资产指纹
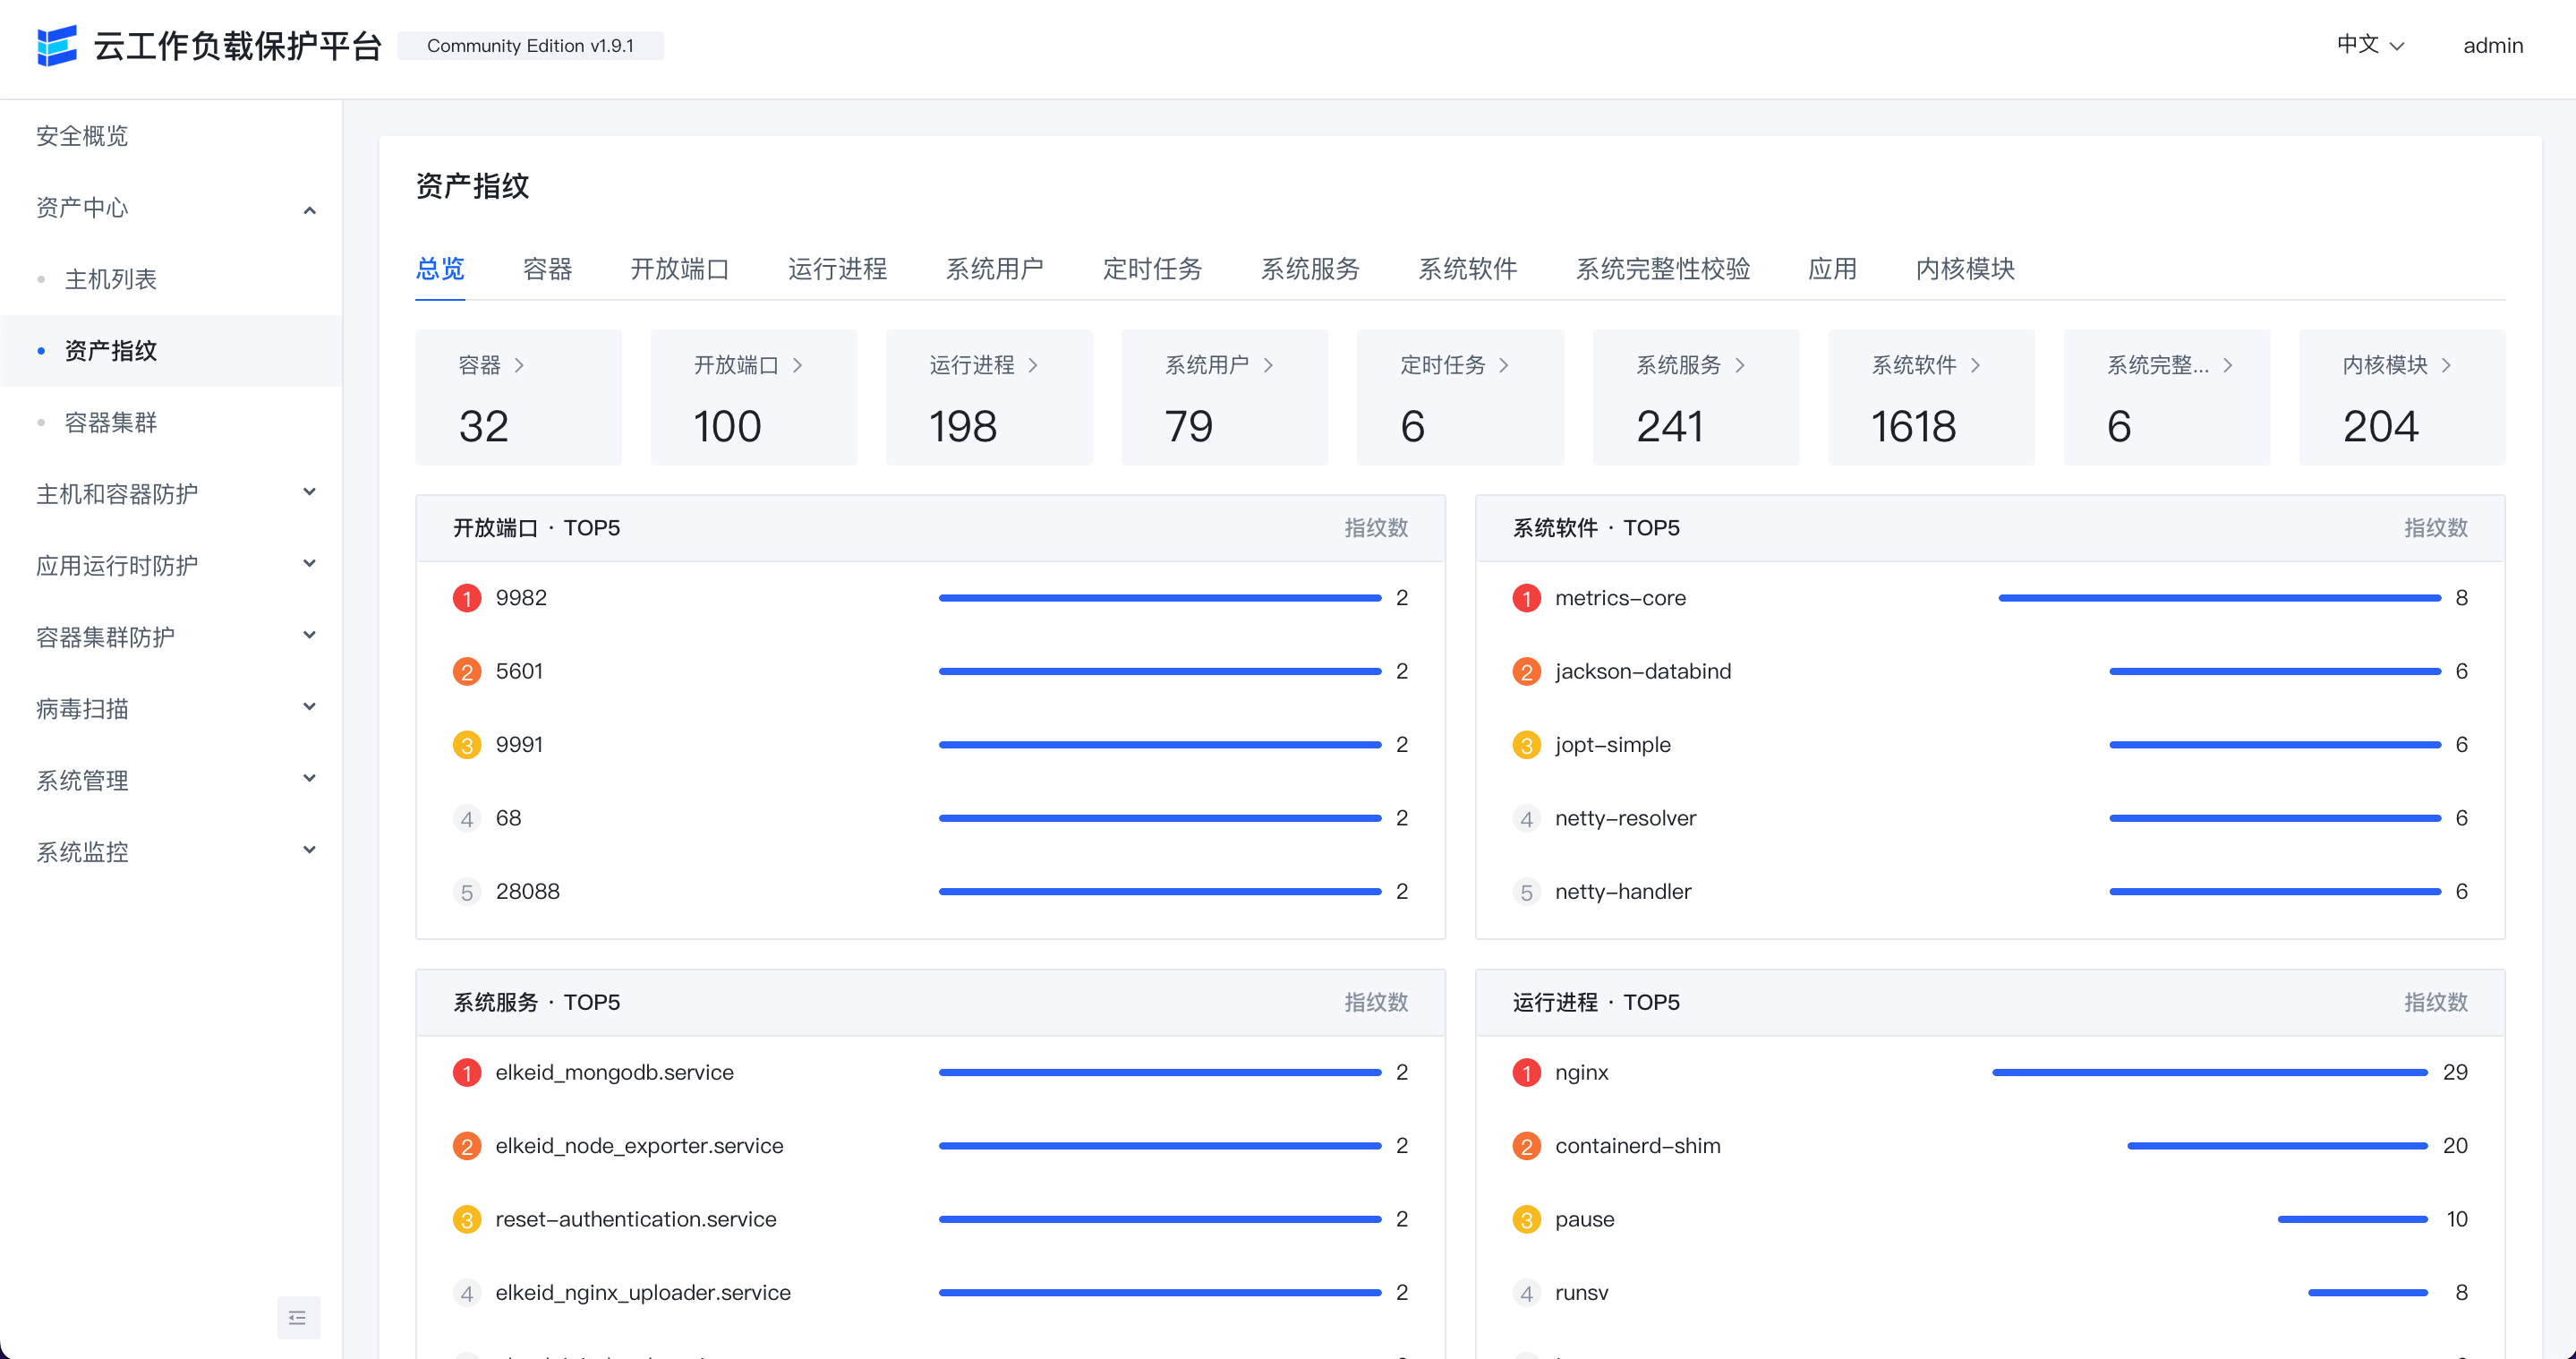
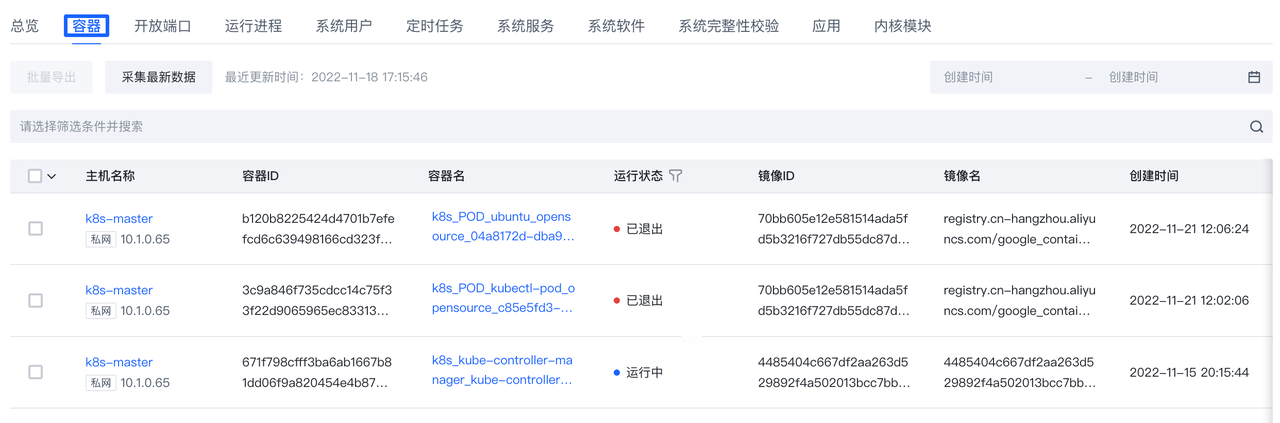
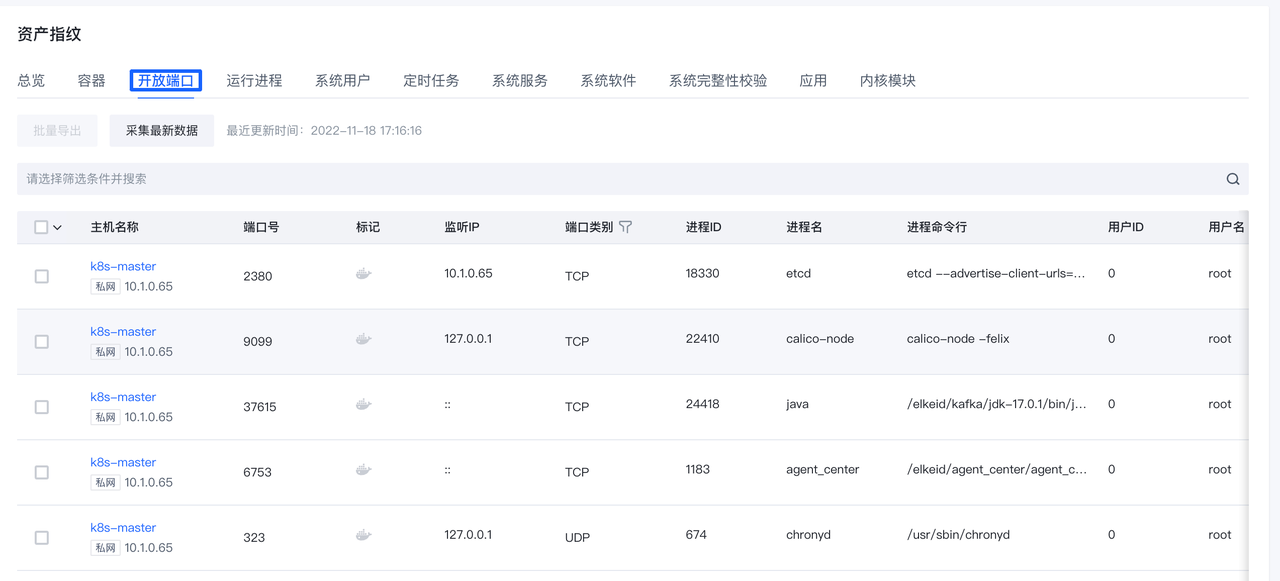
资产指纹
通过该功能查看各主机的开放端口,运行进程,系统用户,定时任务,系统服务,系统软件等详情。
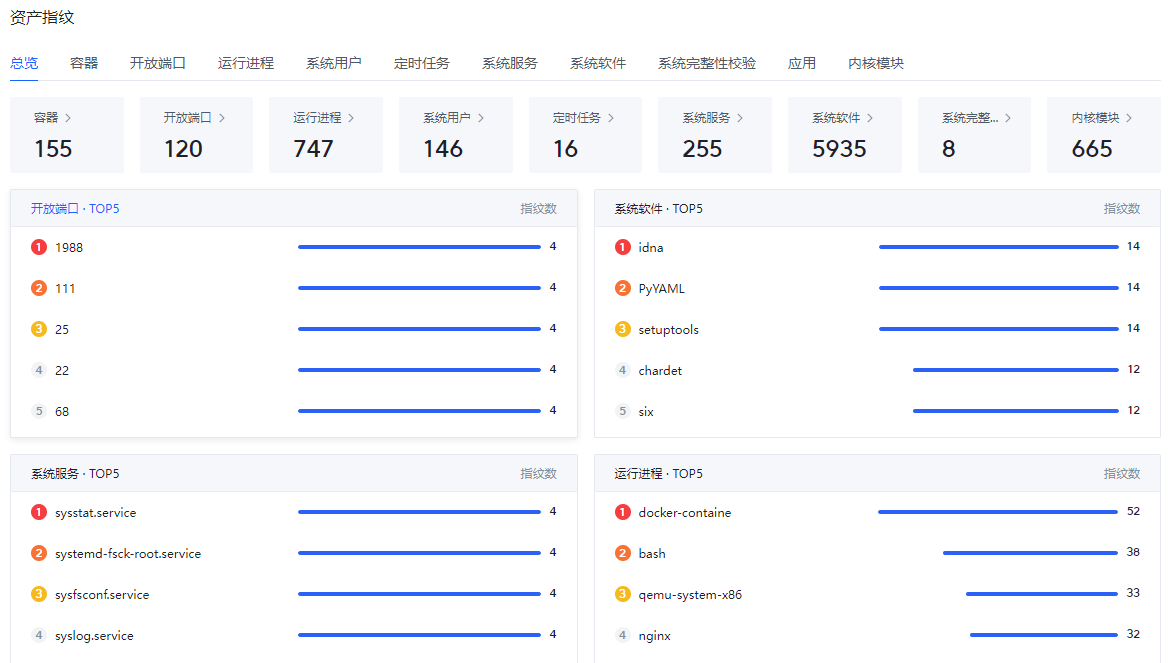
点击页面中各标签可以查看相应资产数据,目前支持下列资产数据:
- 容器
- 开放端口
- 运行进程
- 系统用户
- 定时任务
- 系统服务
- 系统软件
- 系统完整性校验
- 应用
- 内核模块
点击各行的"主机名称"可以跳转到相应主机的详情页,查看此主机资产指纹数据
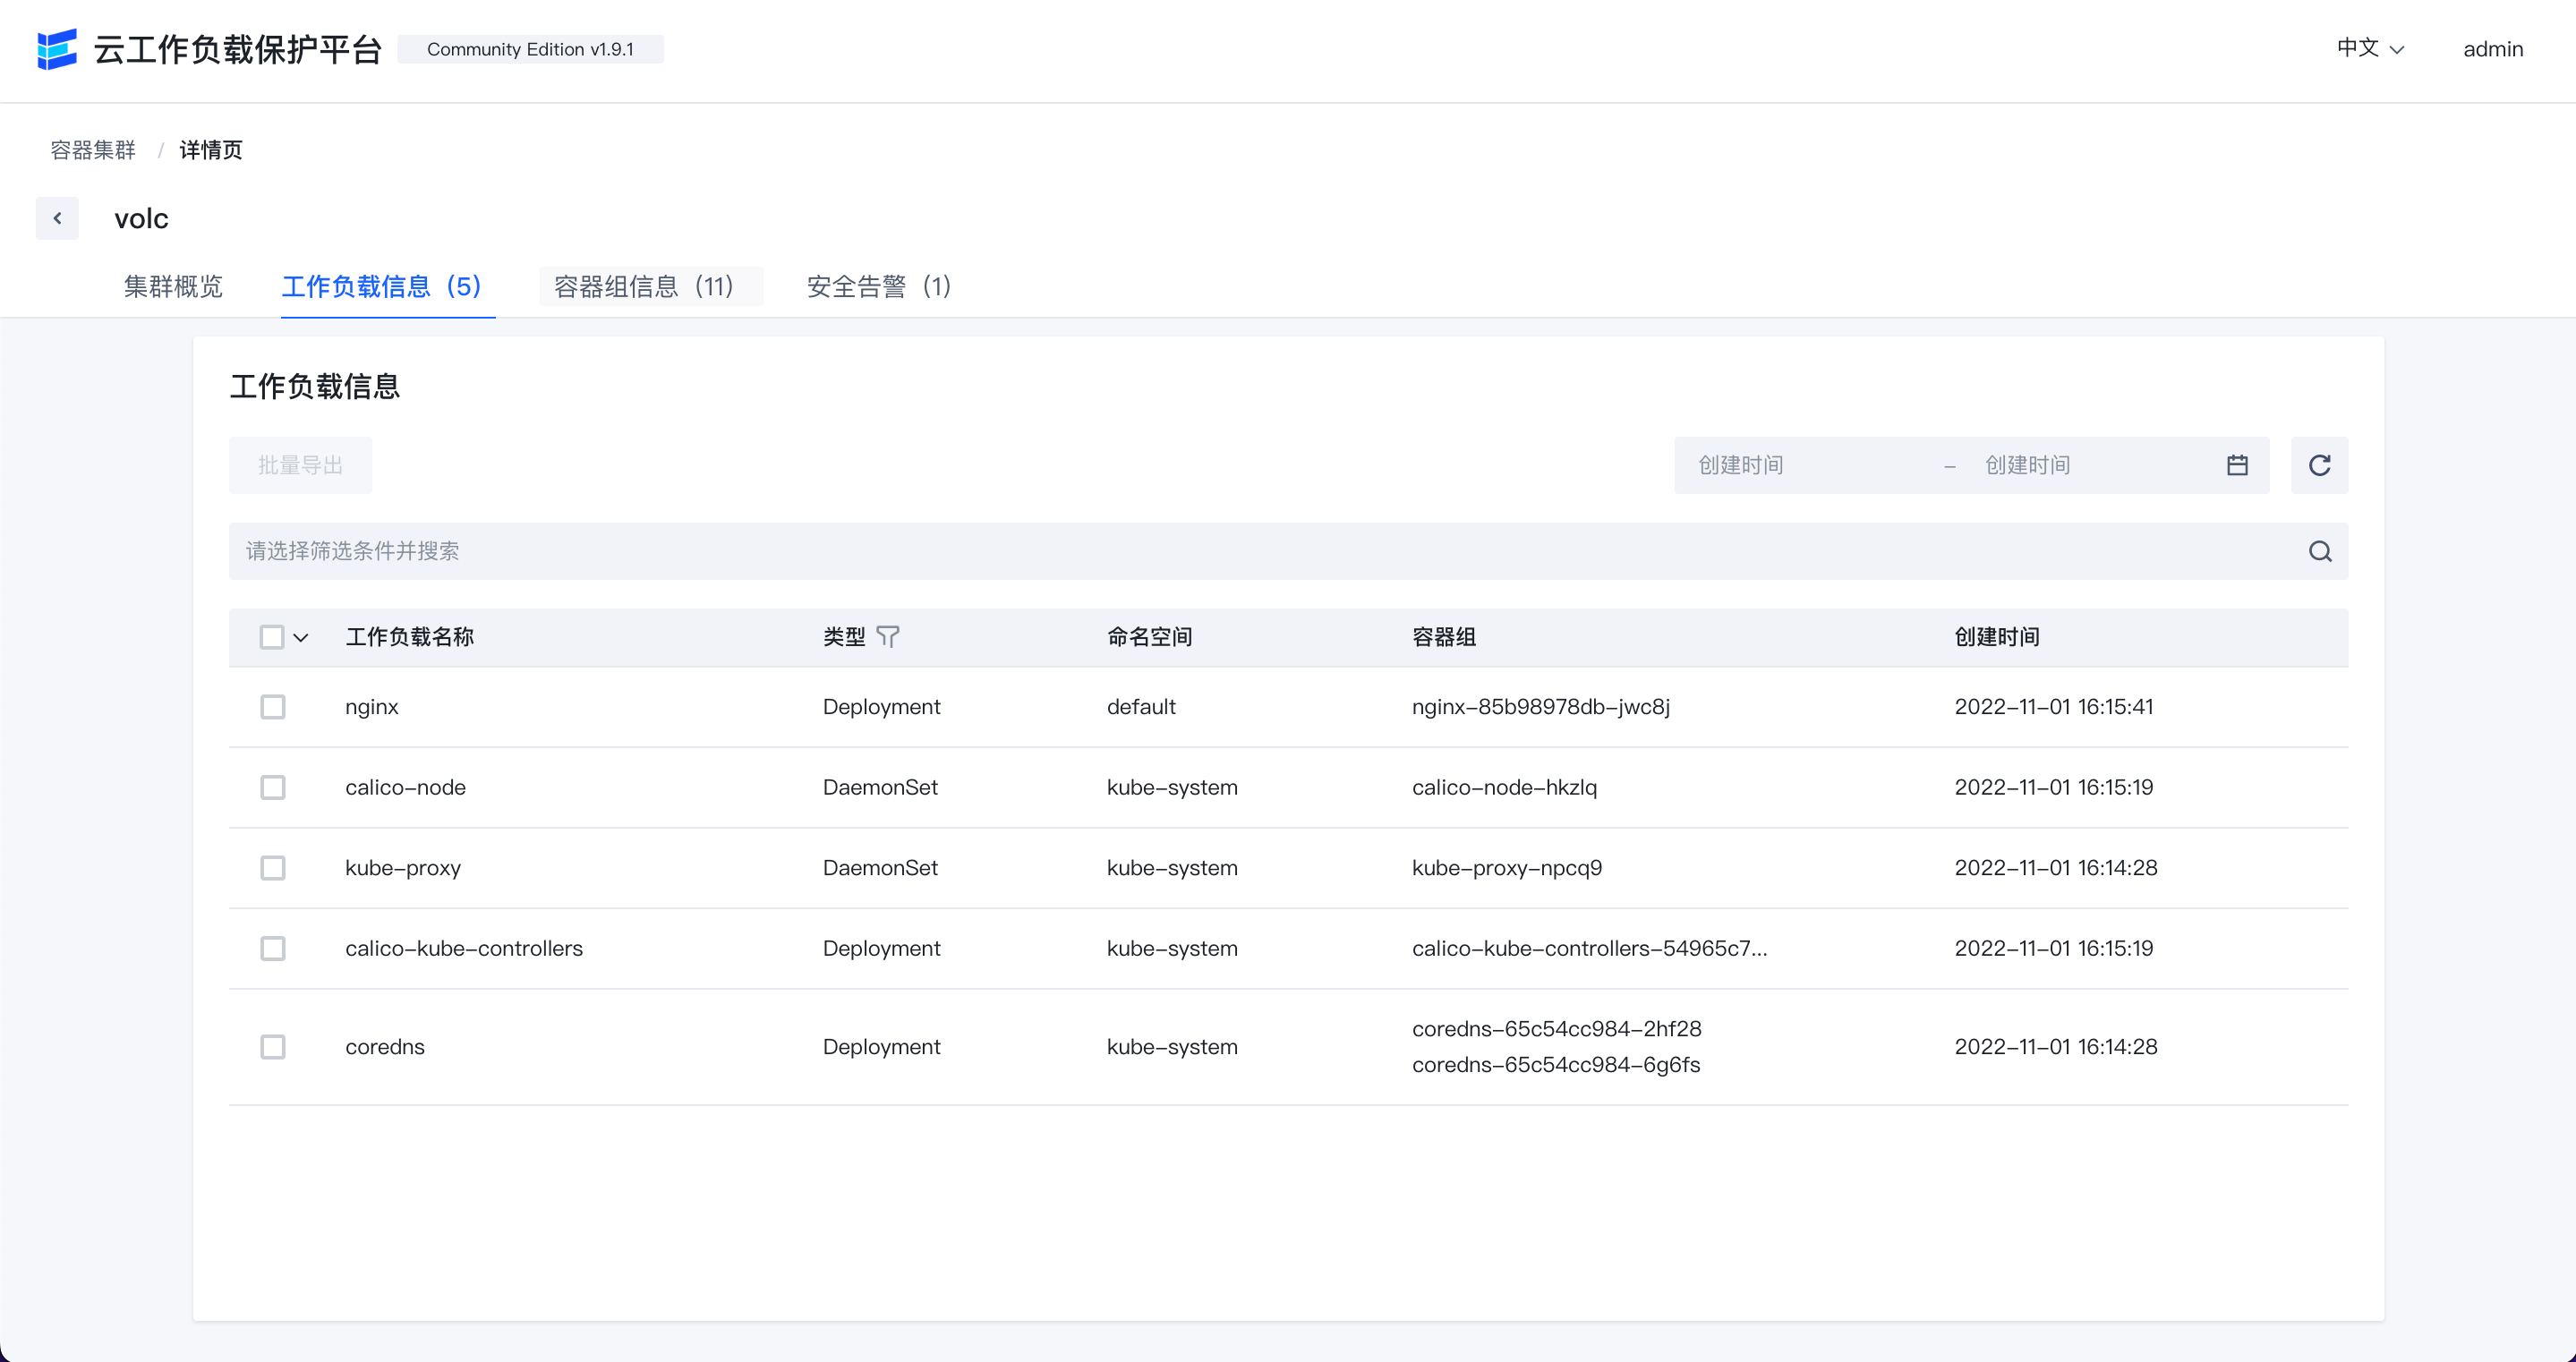
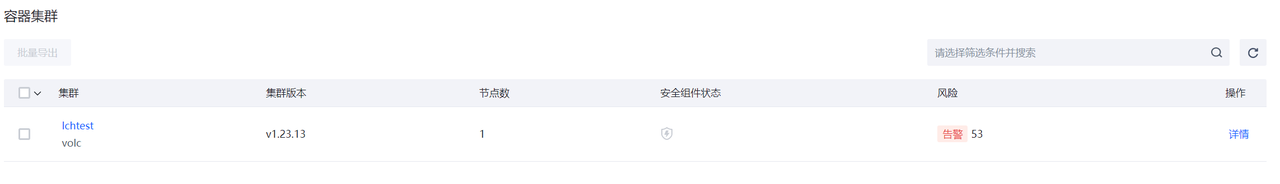
容器集群
展示已经接入容器集群防护能力的容器集群信息。
主机和容器防护
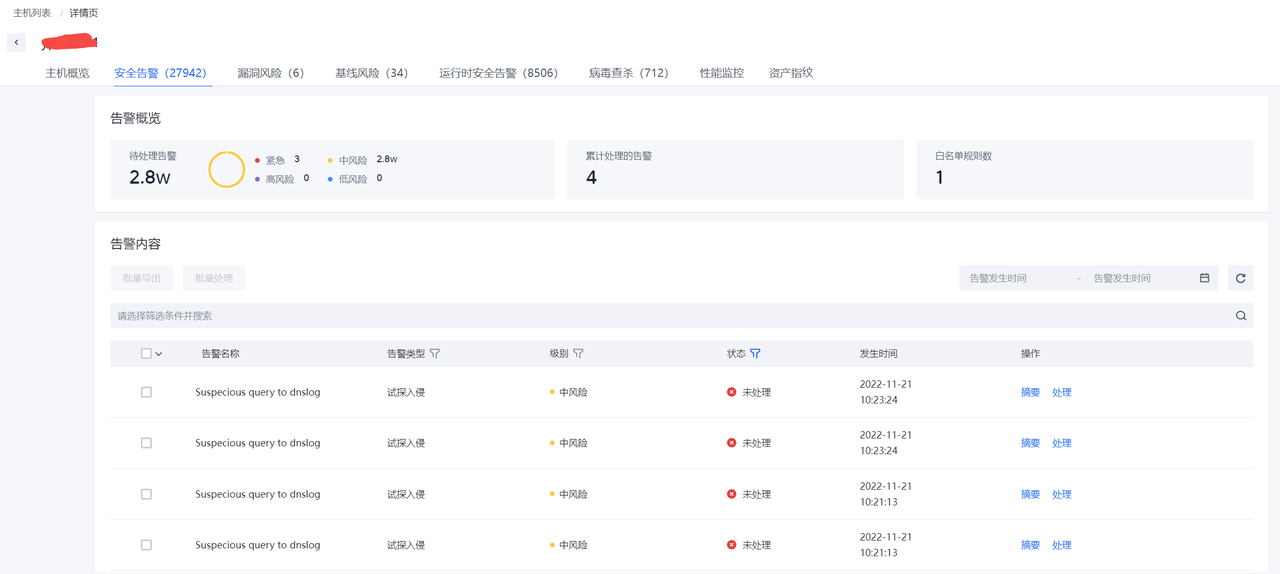
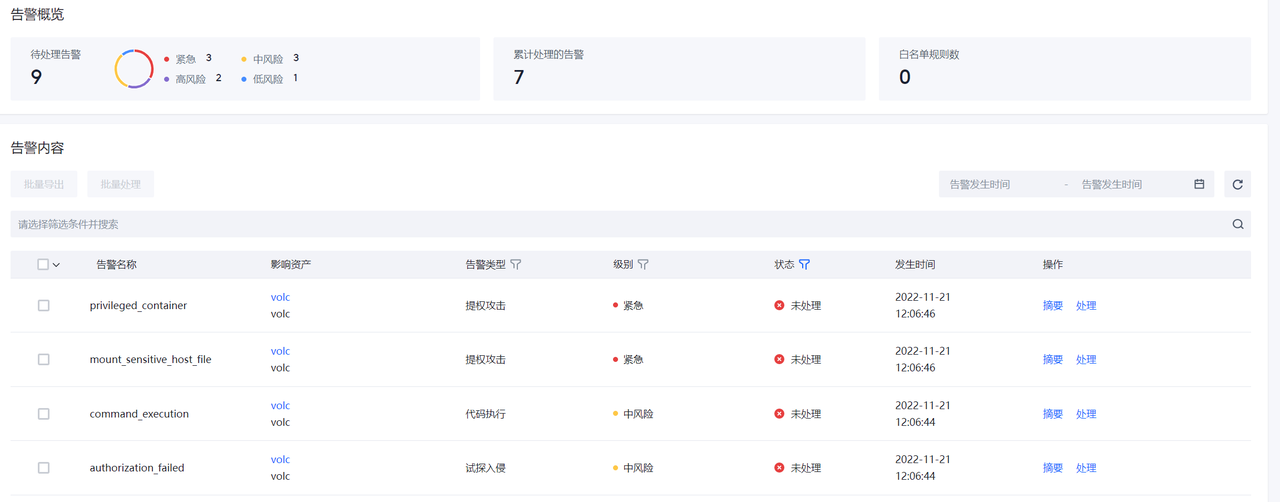
入侵检测
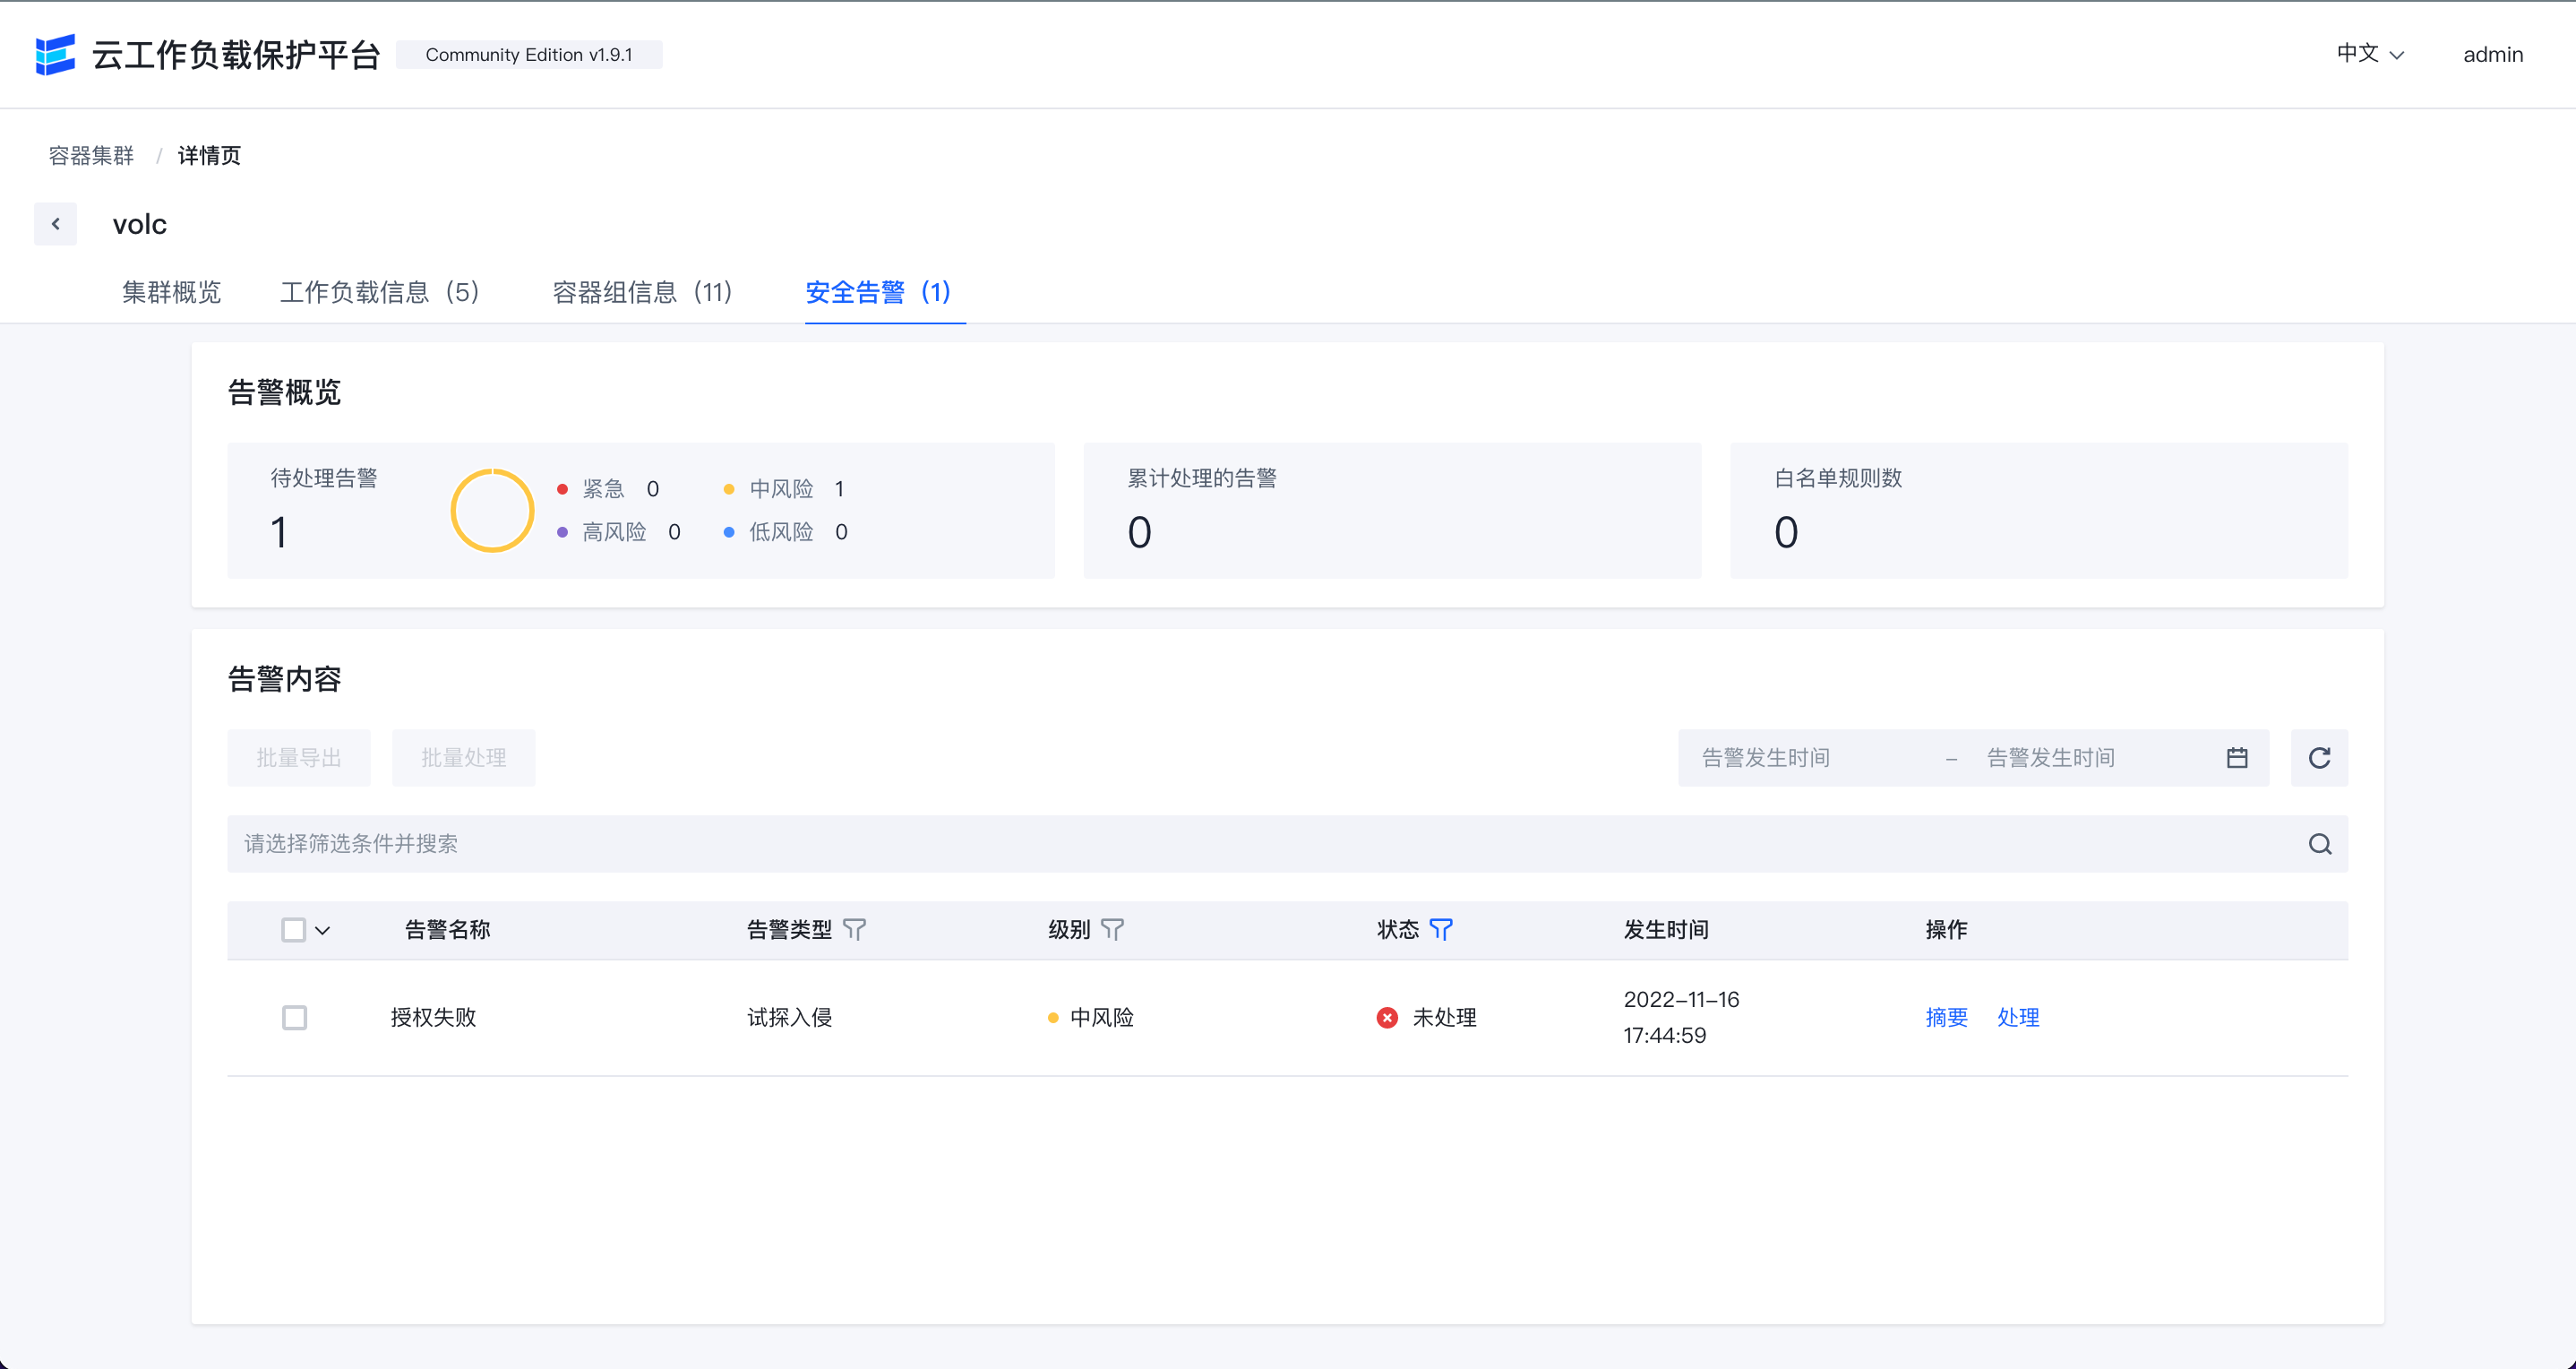
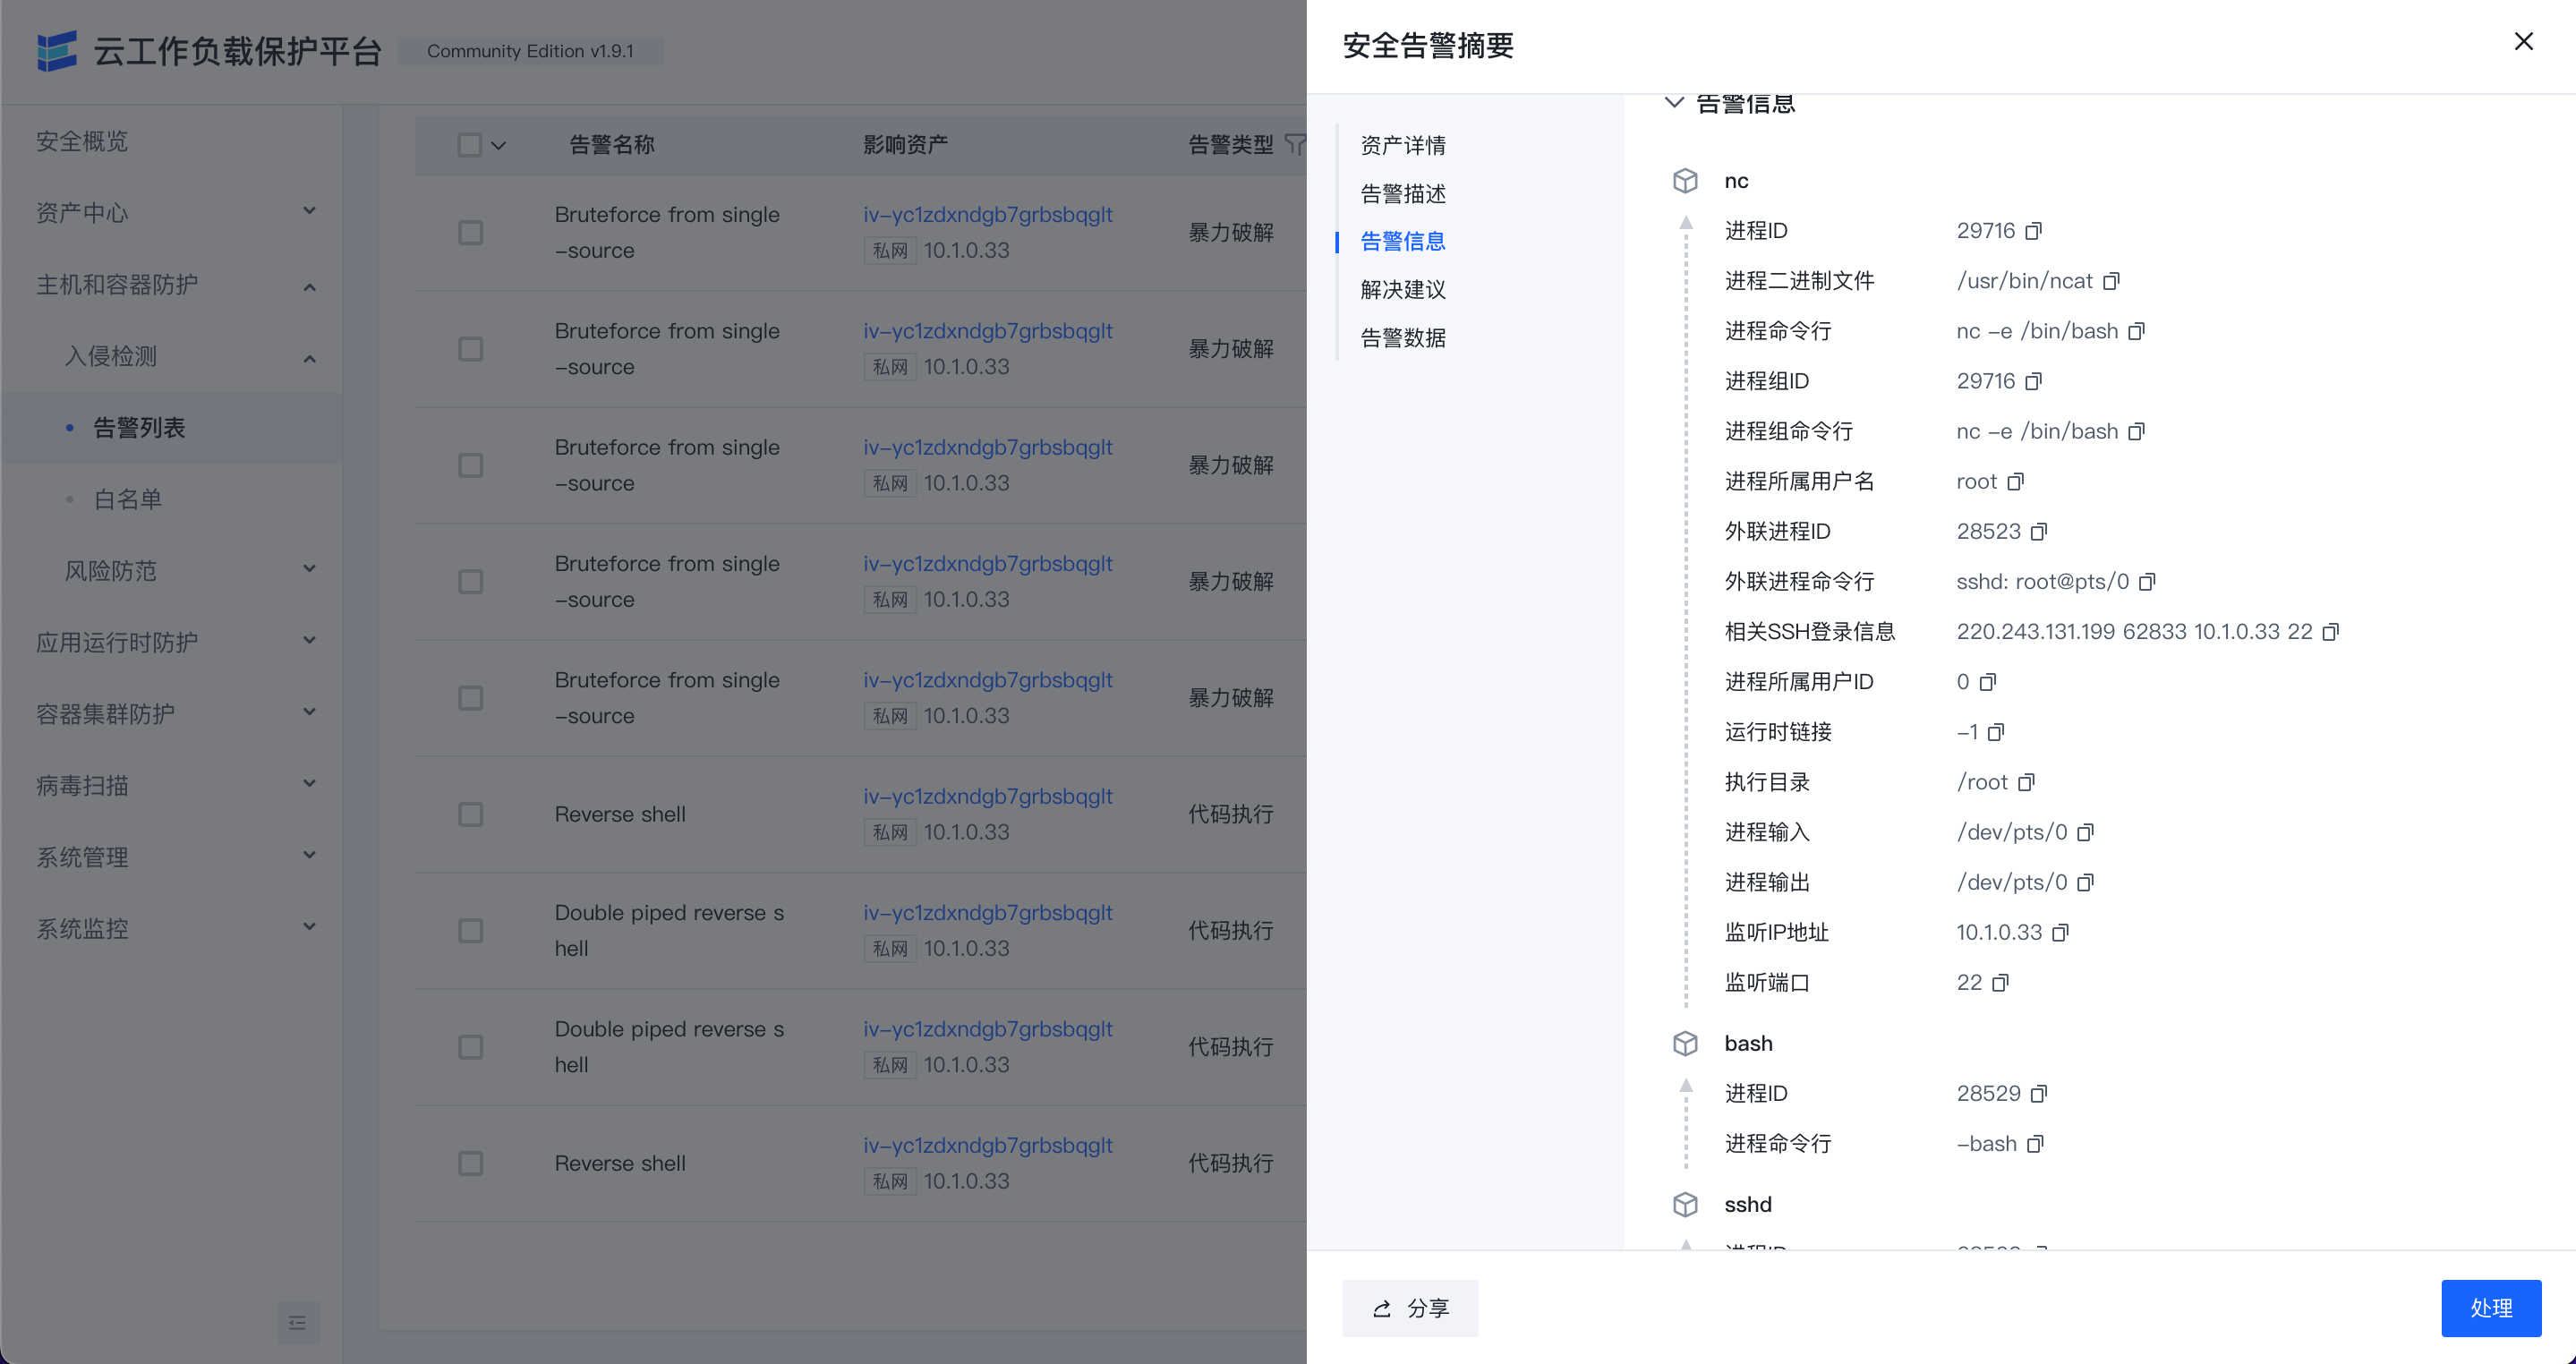
告警列表
告警列表可以查看当前环境内存在的安全告警列表。
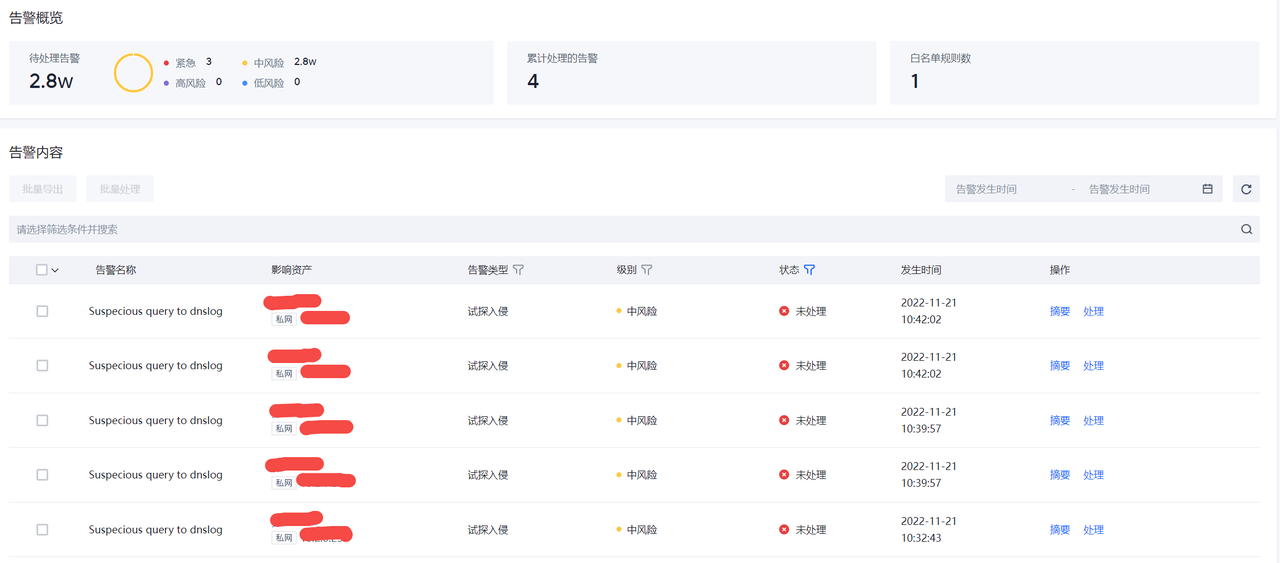
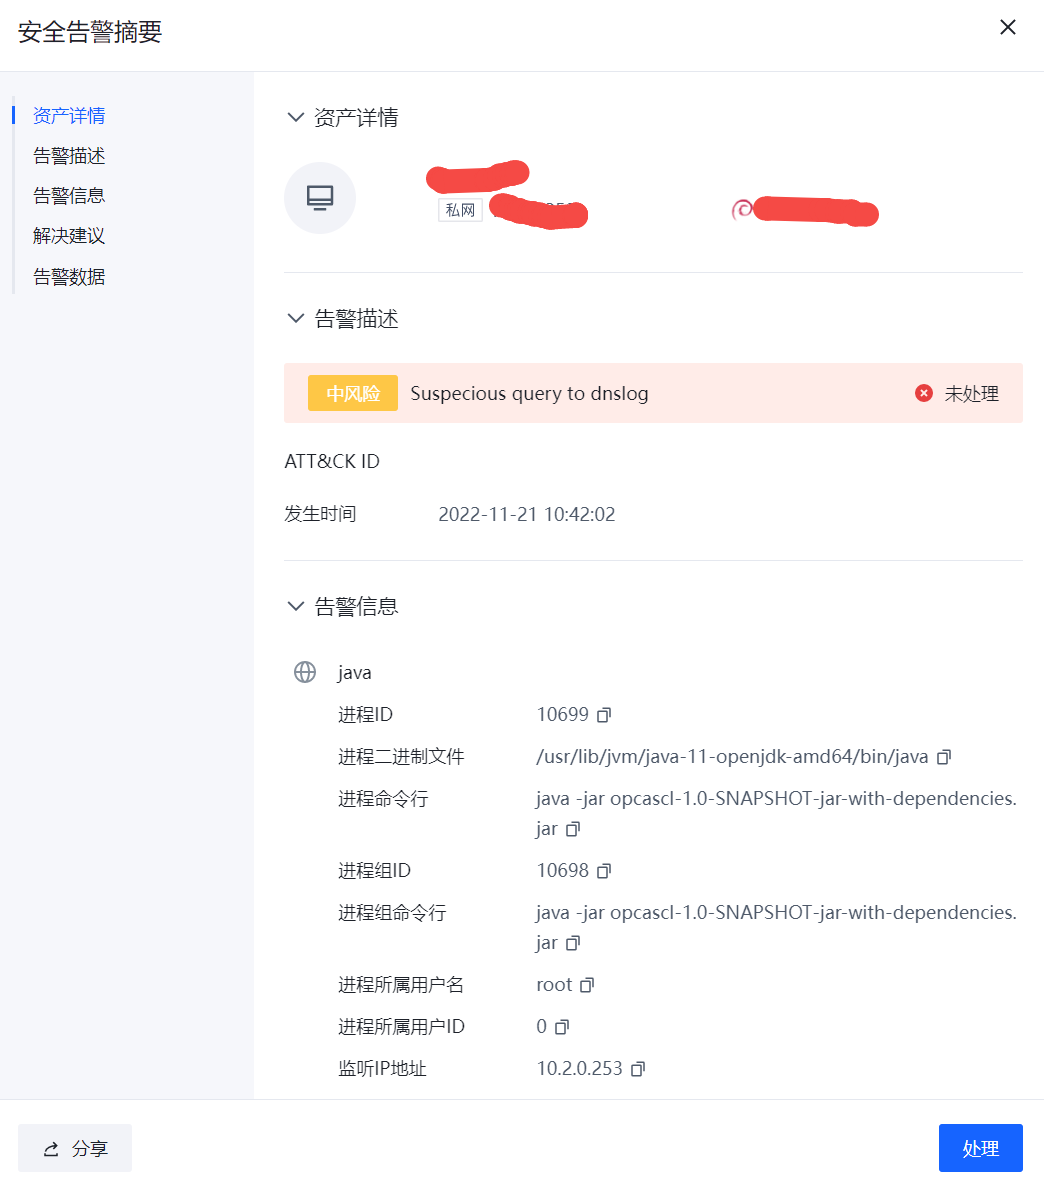
点击"摘要"可以查看告警关键摘要信息。
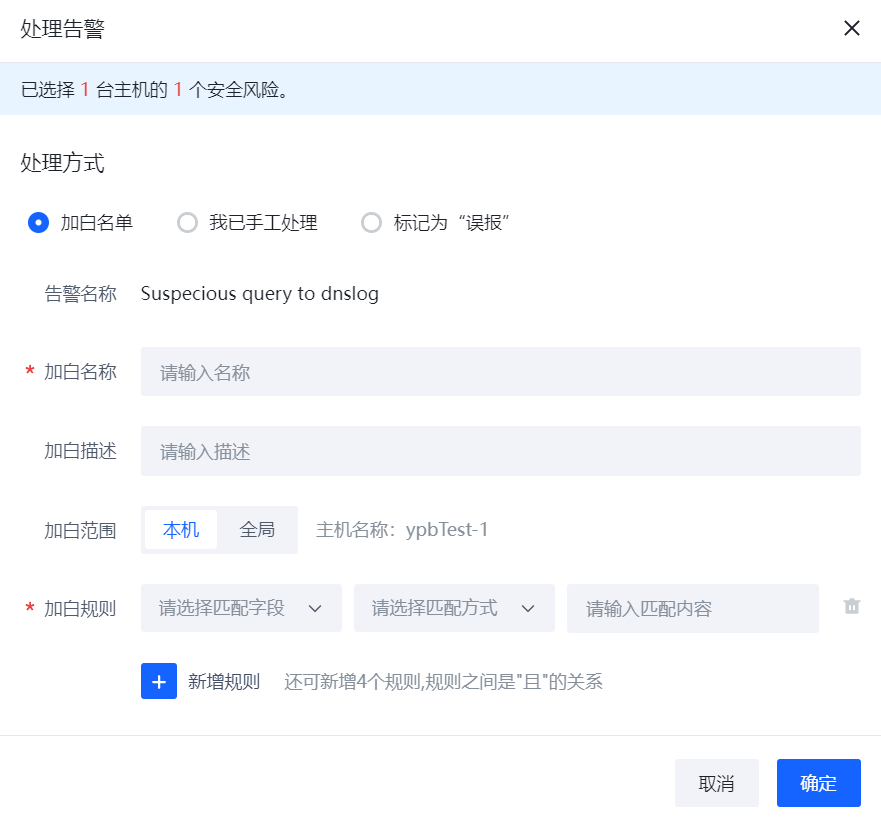
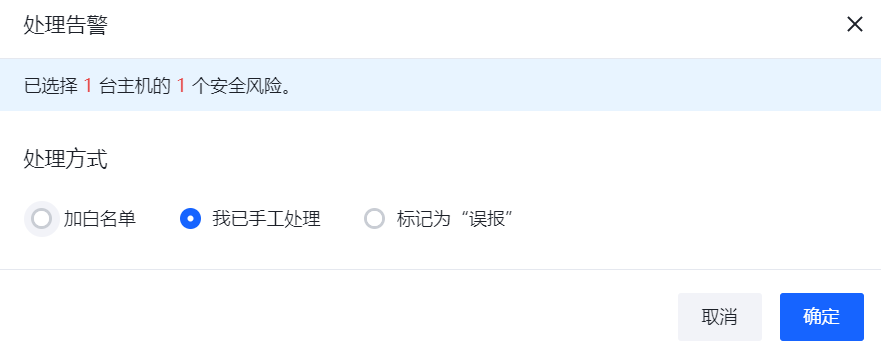
点击”处理”可以进行告警的处理,目前处理操作支持"加白","已人工处理"和“误报”。
点击各行的“影响资产”可以跳转到关联的主机详情页面查看相关数据。
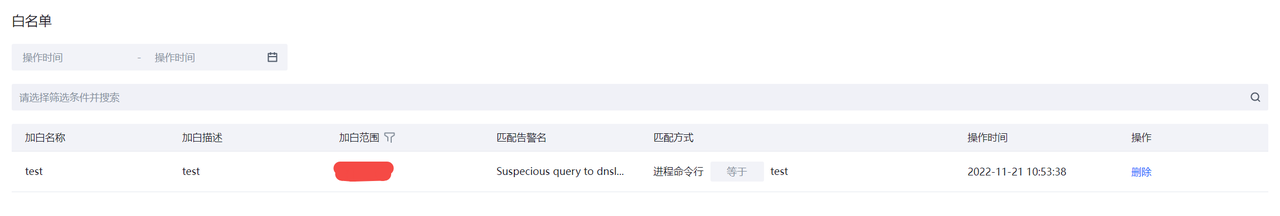
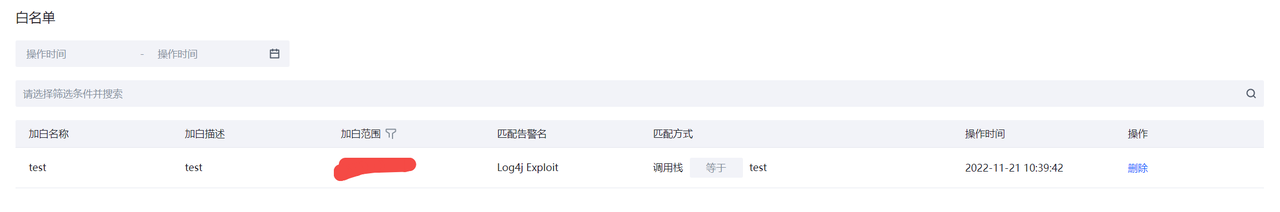
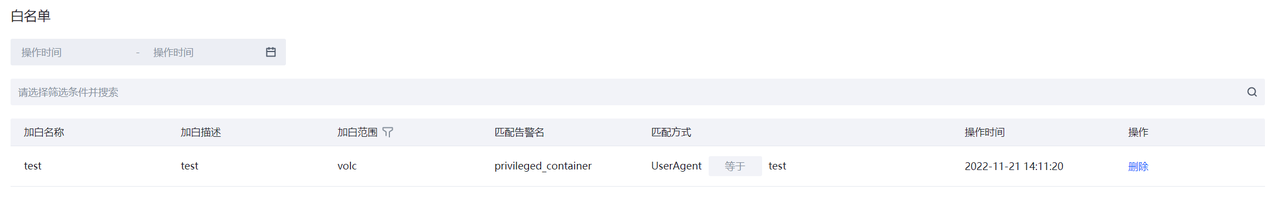
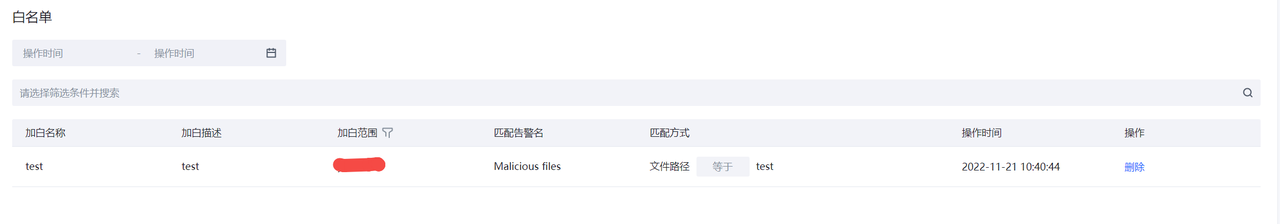
白名单
主机和容器防护告警的白名单。
风险防范
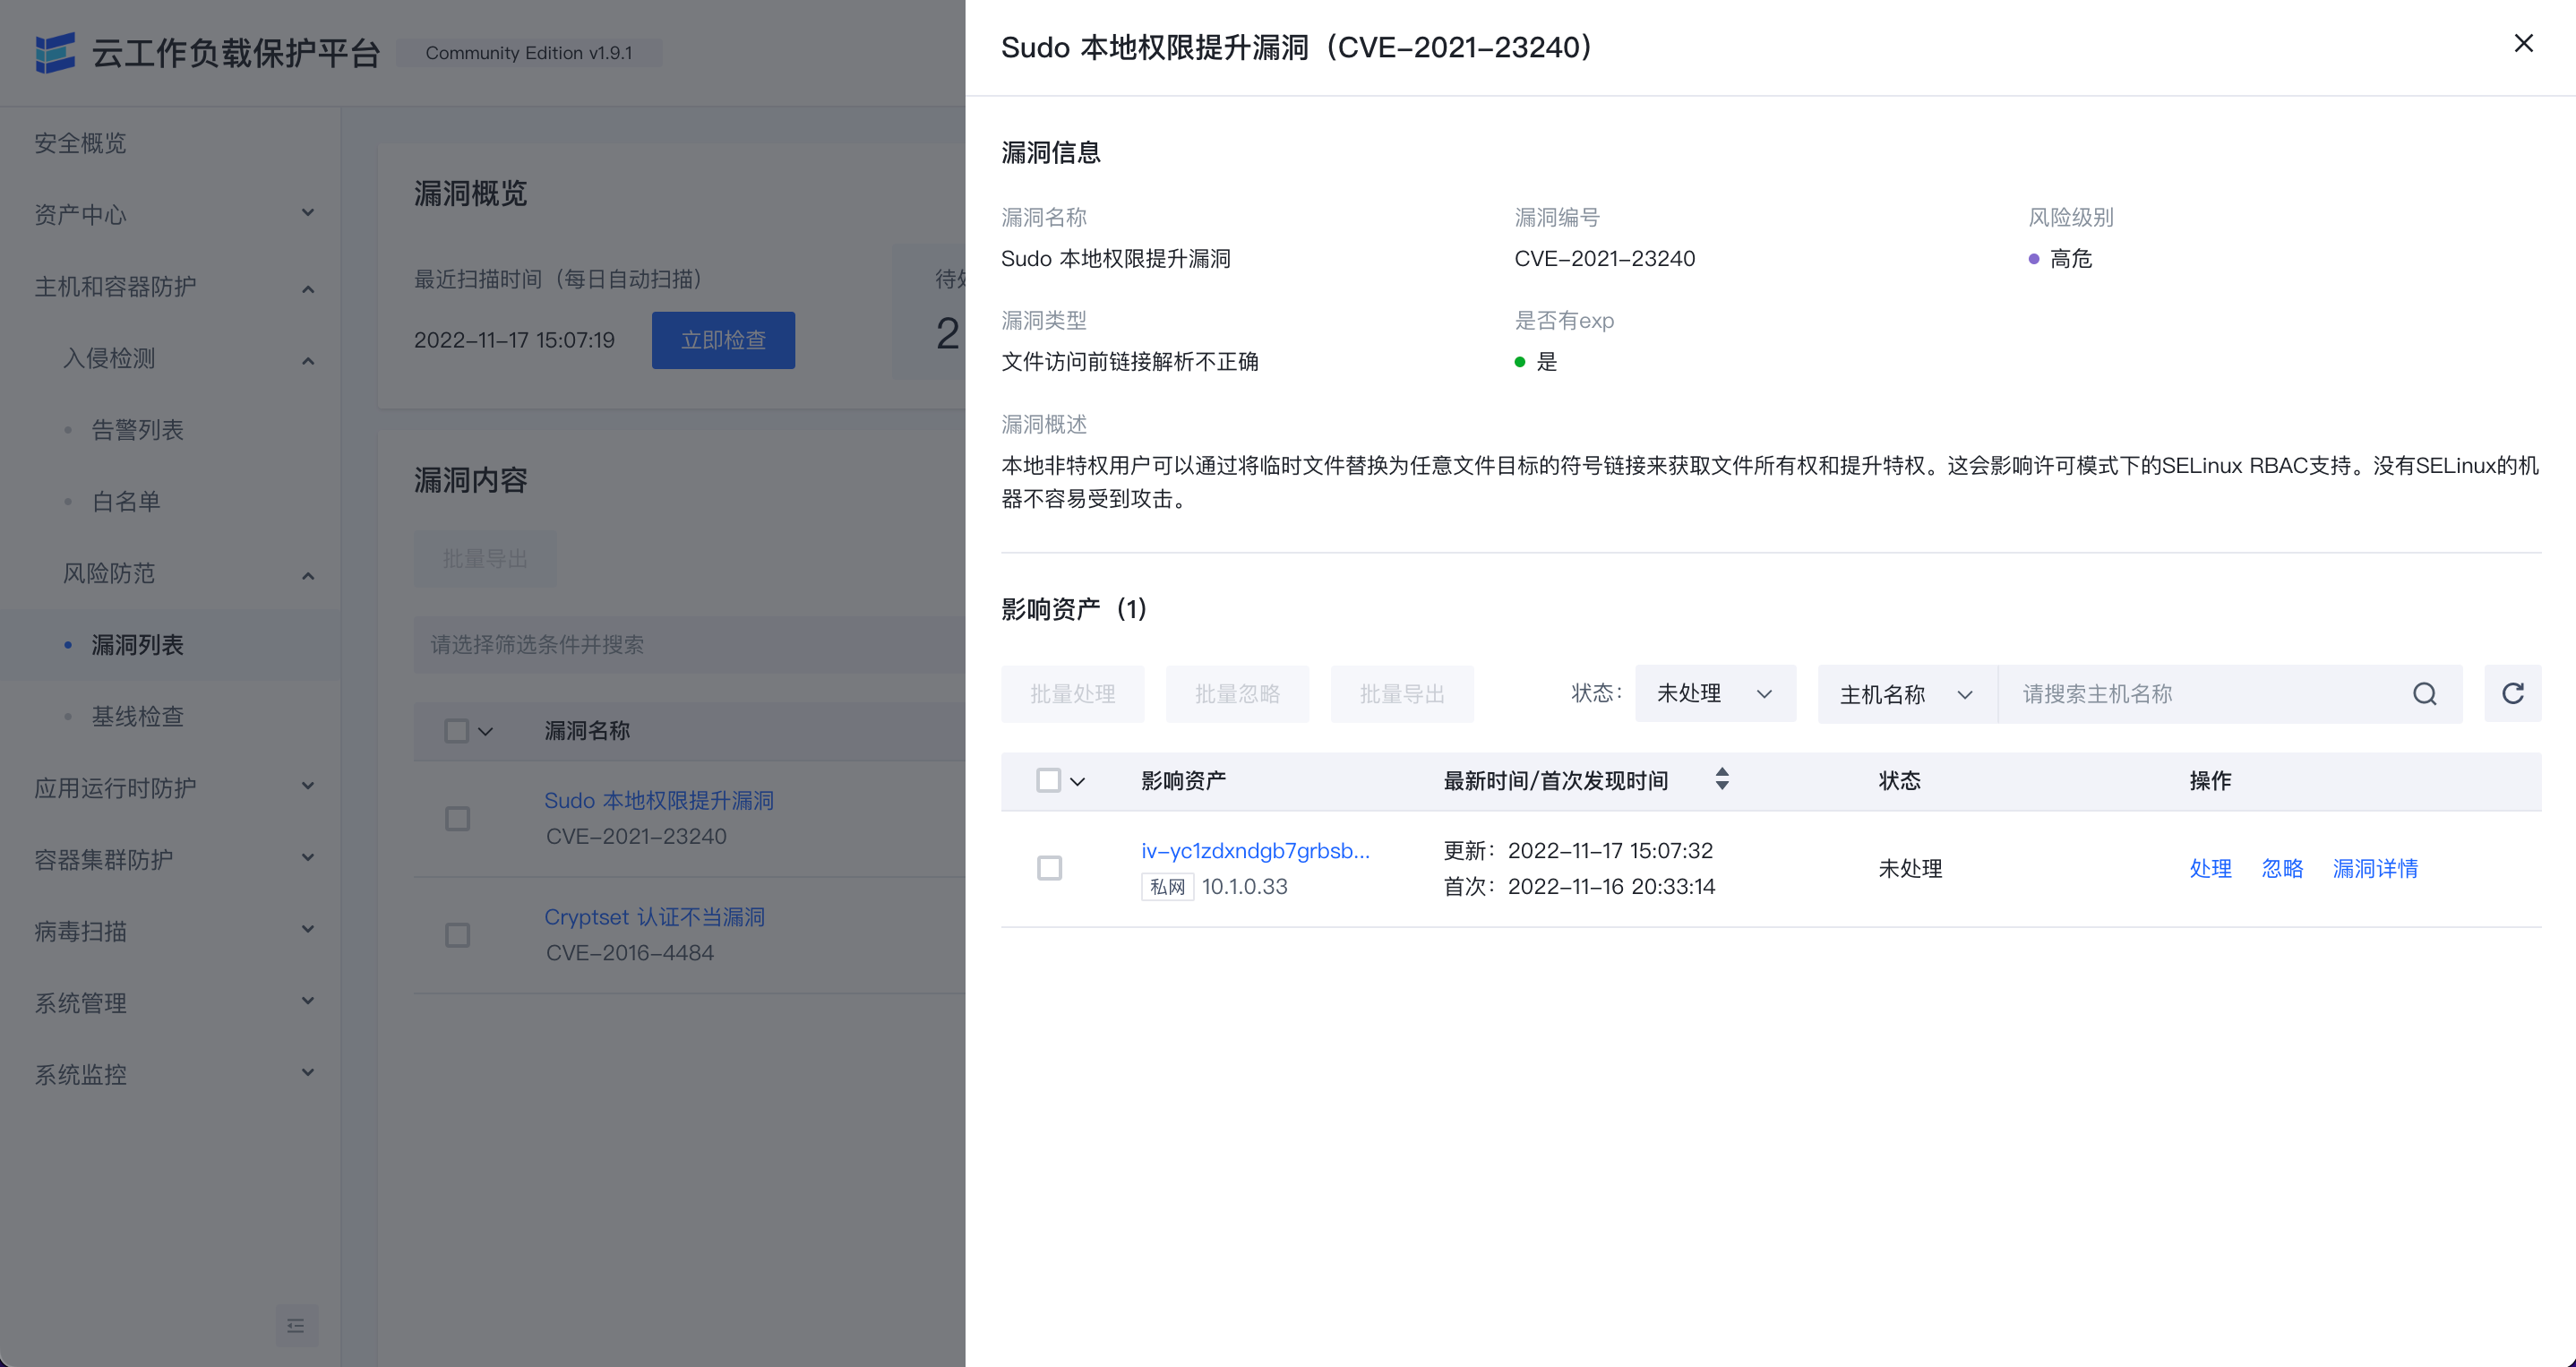
漏洞列表
漏洞列表页面可以查看当前环境内存在的安全漏洞风险,默认只显示高风险漏洞的信息,用户通过立即检查来检测环境中最新存在的安全漏洞。

在漏洞列表数据右侧点击详情可以查看漏洞信息以及影响的资产列表。
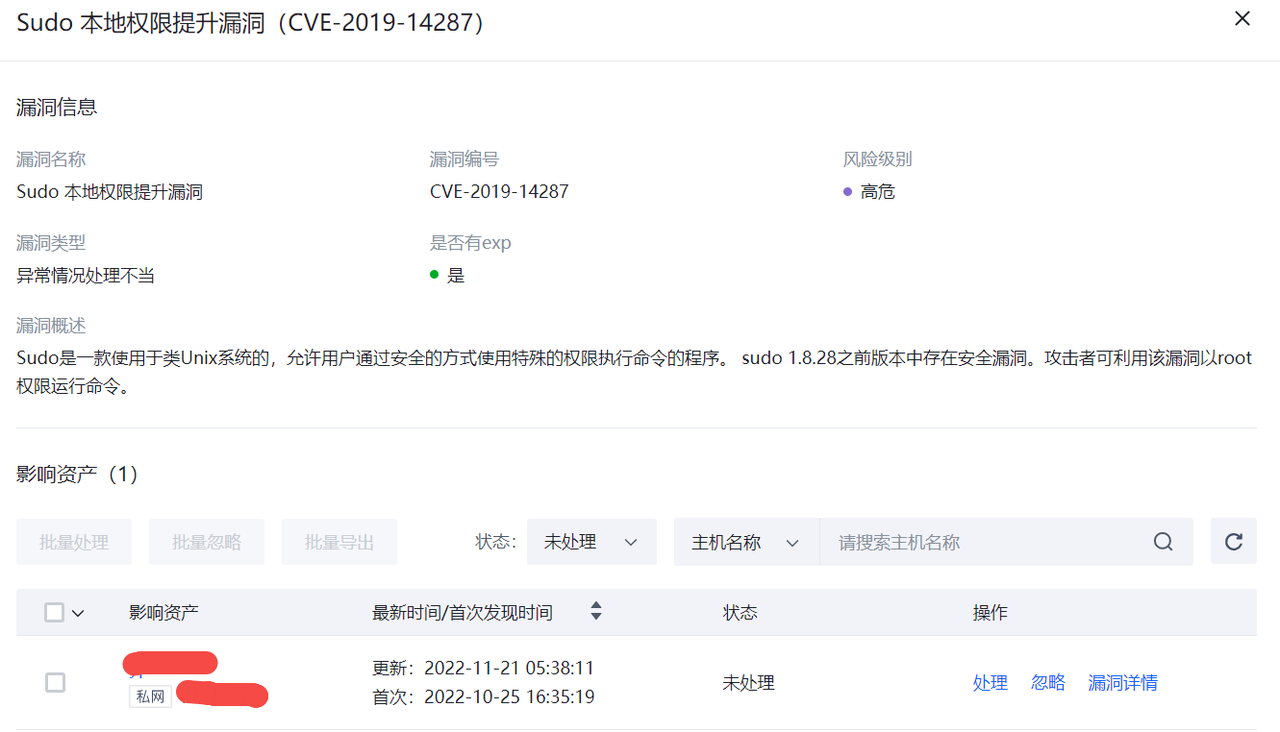
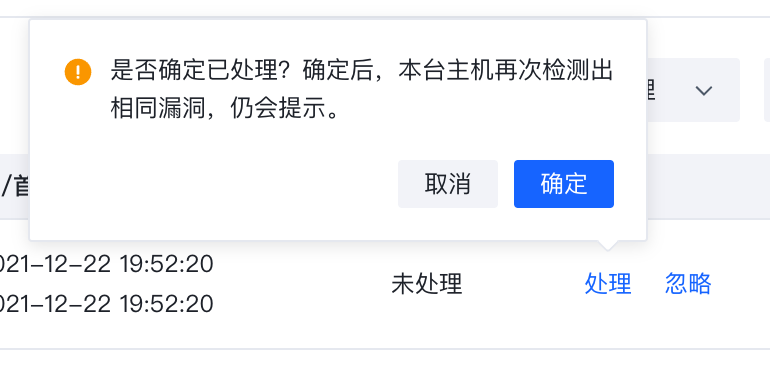
漏洞信息也可以通过处置与忽略进行标记。
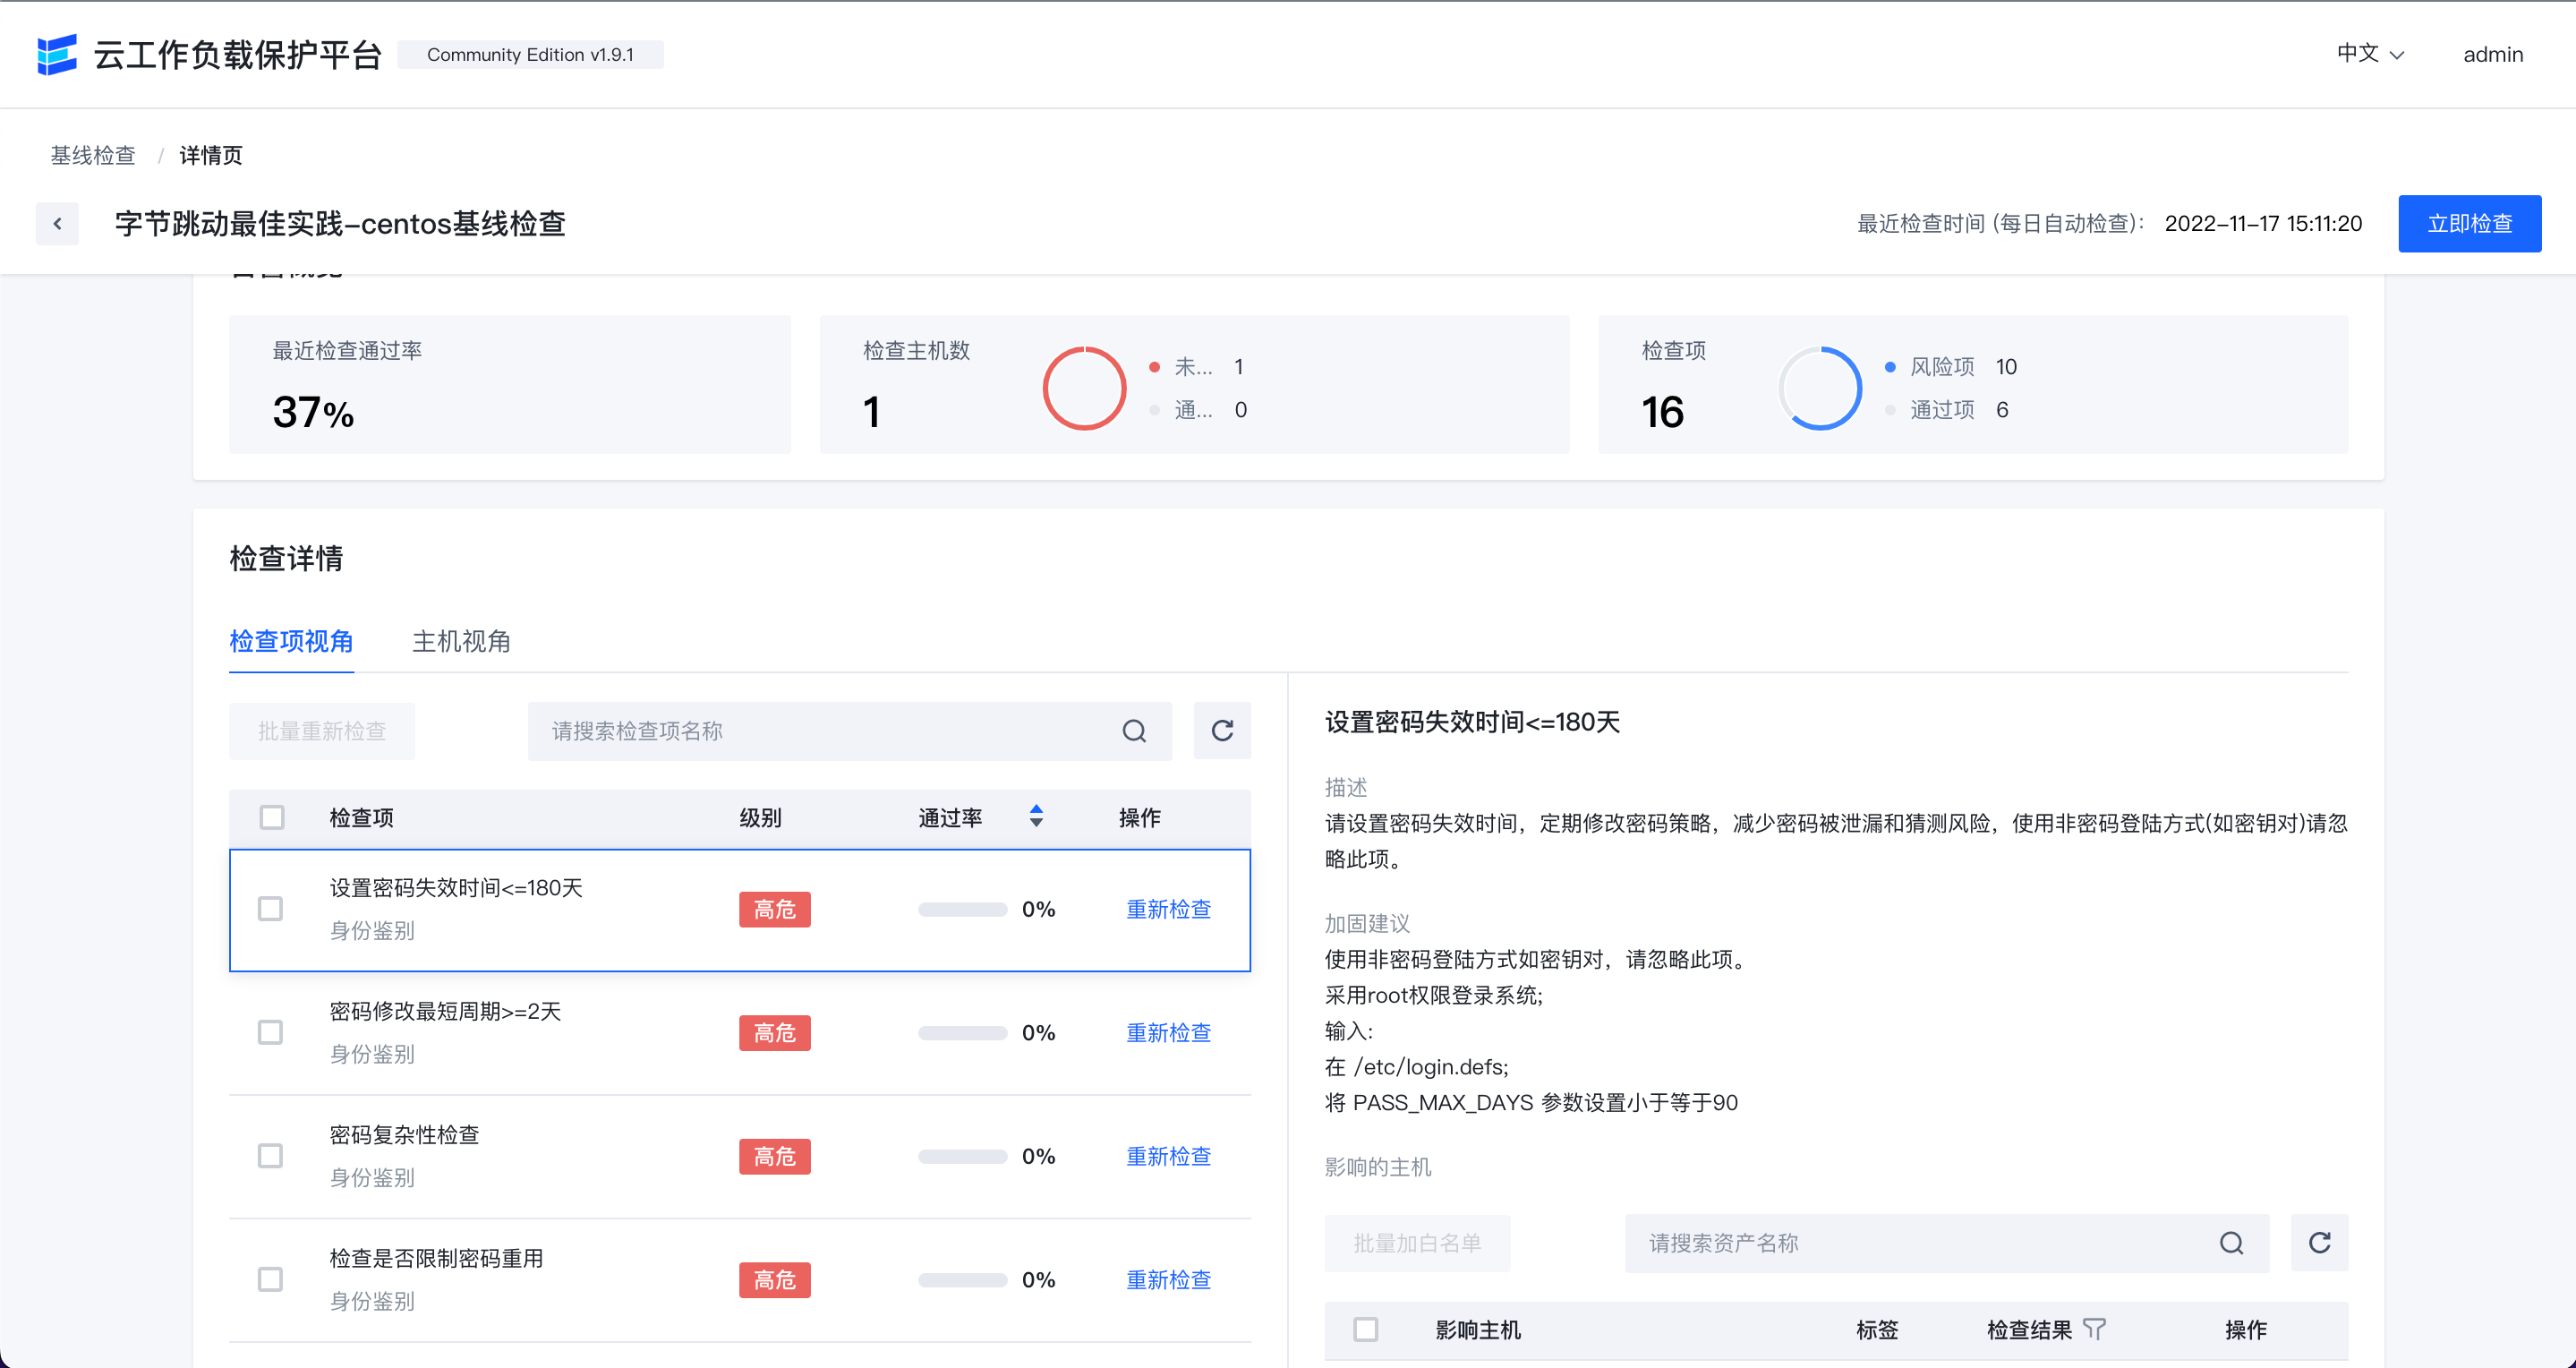
基线检查
基线检查页面可以查看当前环境内存在的安全基线风险,可以通过立即检查来查看环境中最新存在的安全基线问题。
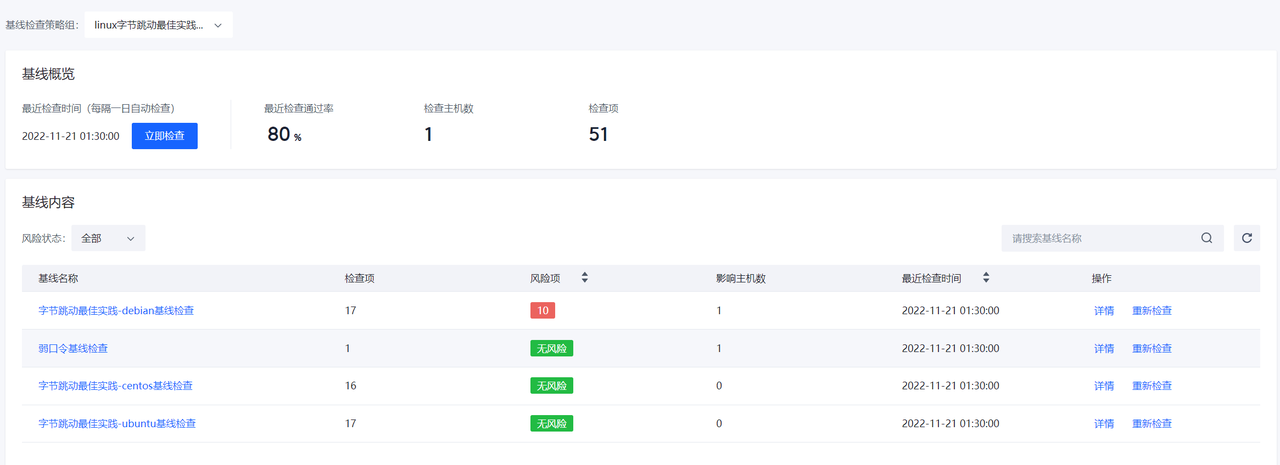
在基线列表右侧点击详情可以看到相应的基线详情。
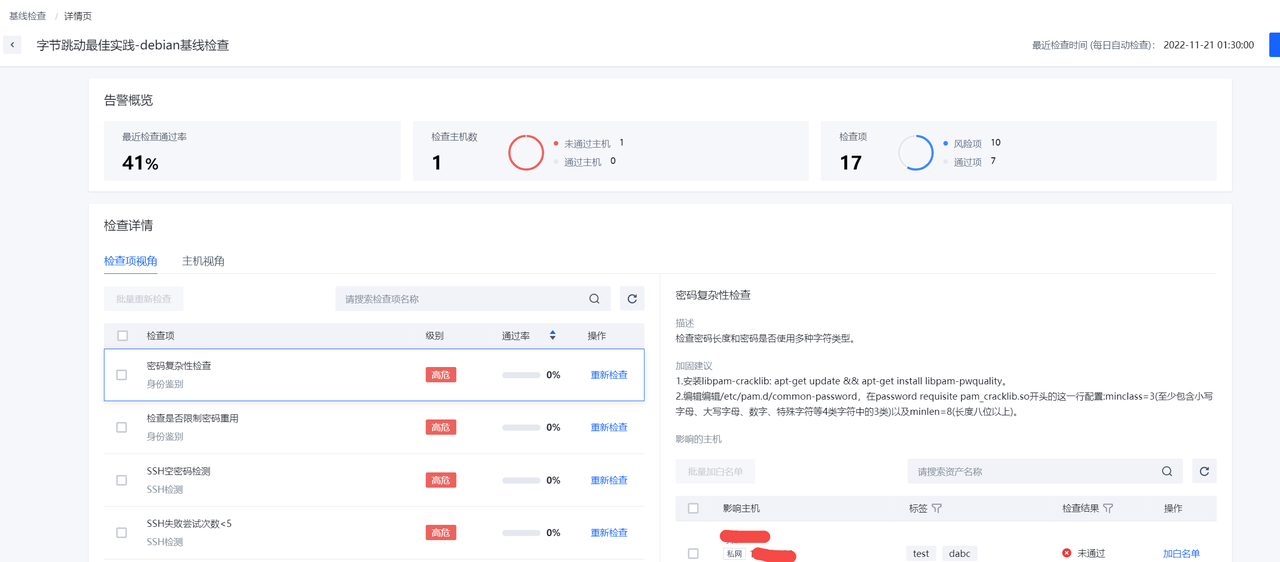
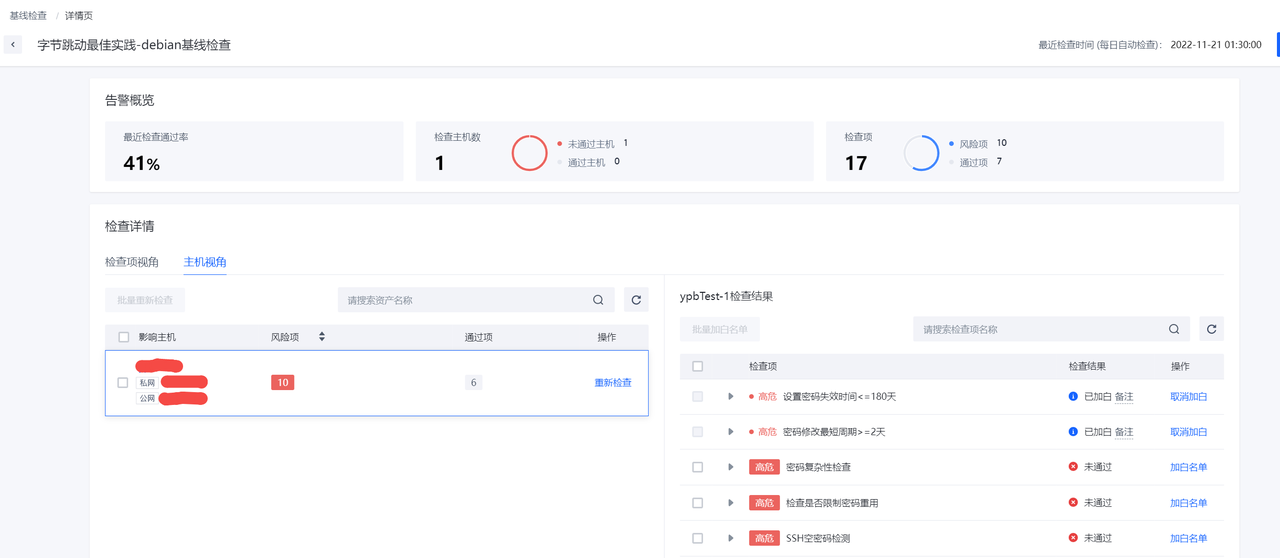
点击加白名单可以进行加白操作。

应用运行时安全防护
运行状态
展示运行时安全组件的覆盖情况。
配置管理
进行运行时安全组件的配置管理。
入侵检测
告警列表
运行时安全检测发现的安全告警展示。
白名单
运行时安全检测告警过滤白名单规则展示。
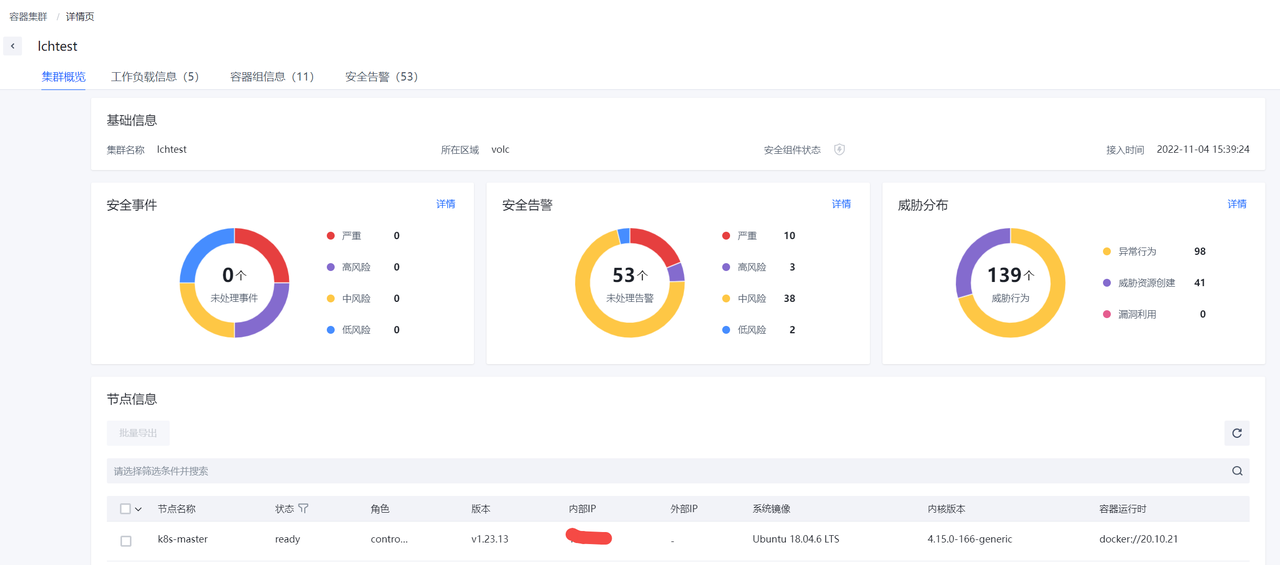
容器集群防护
入侵检测
告警列表
容器集群防护发现的安全告警展示。
白名单
容器集群防护告警过滤白名单规则展示。
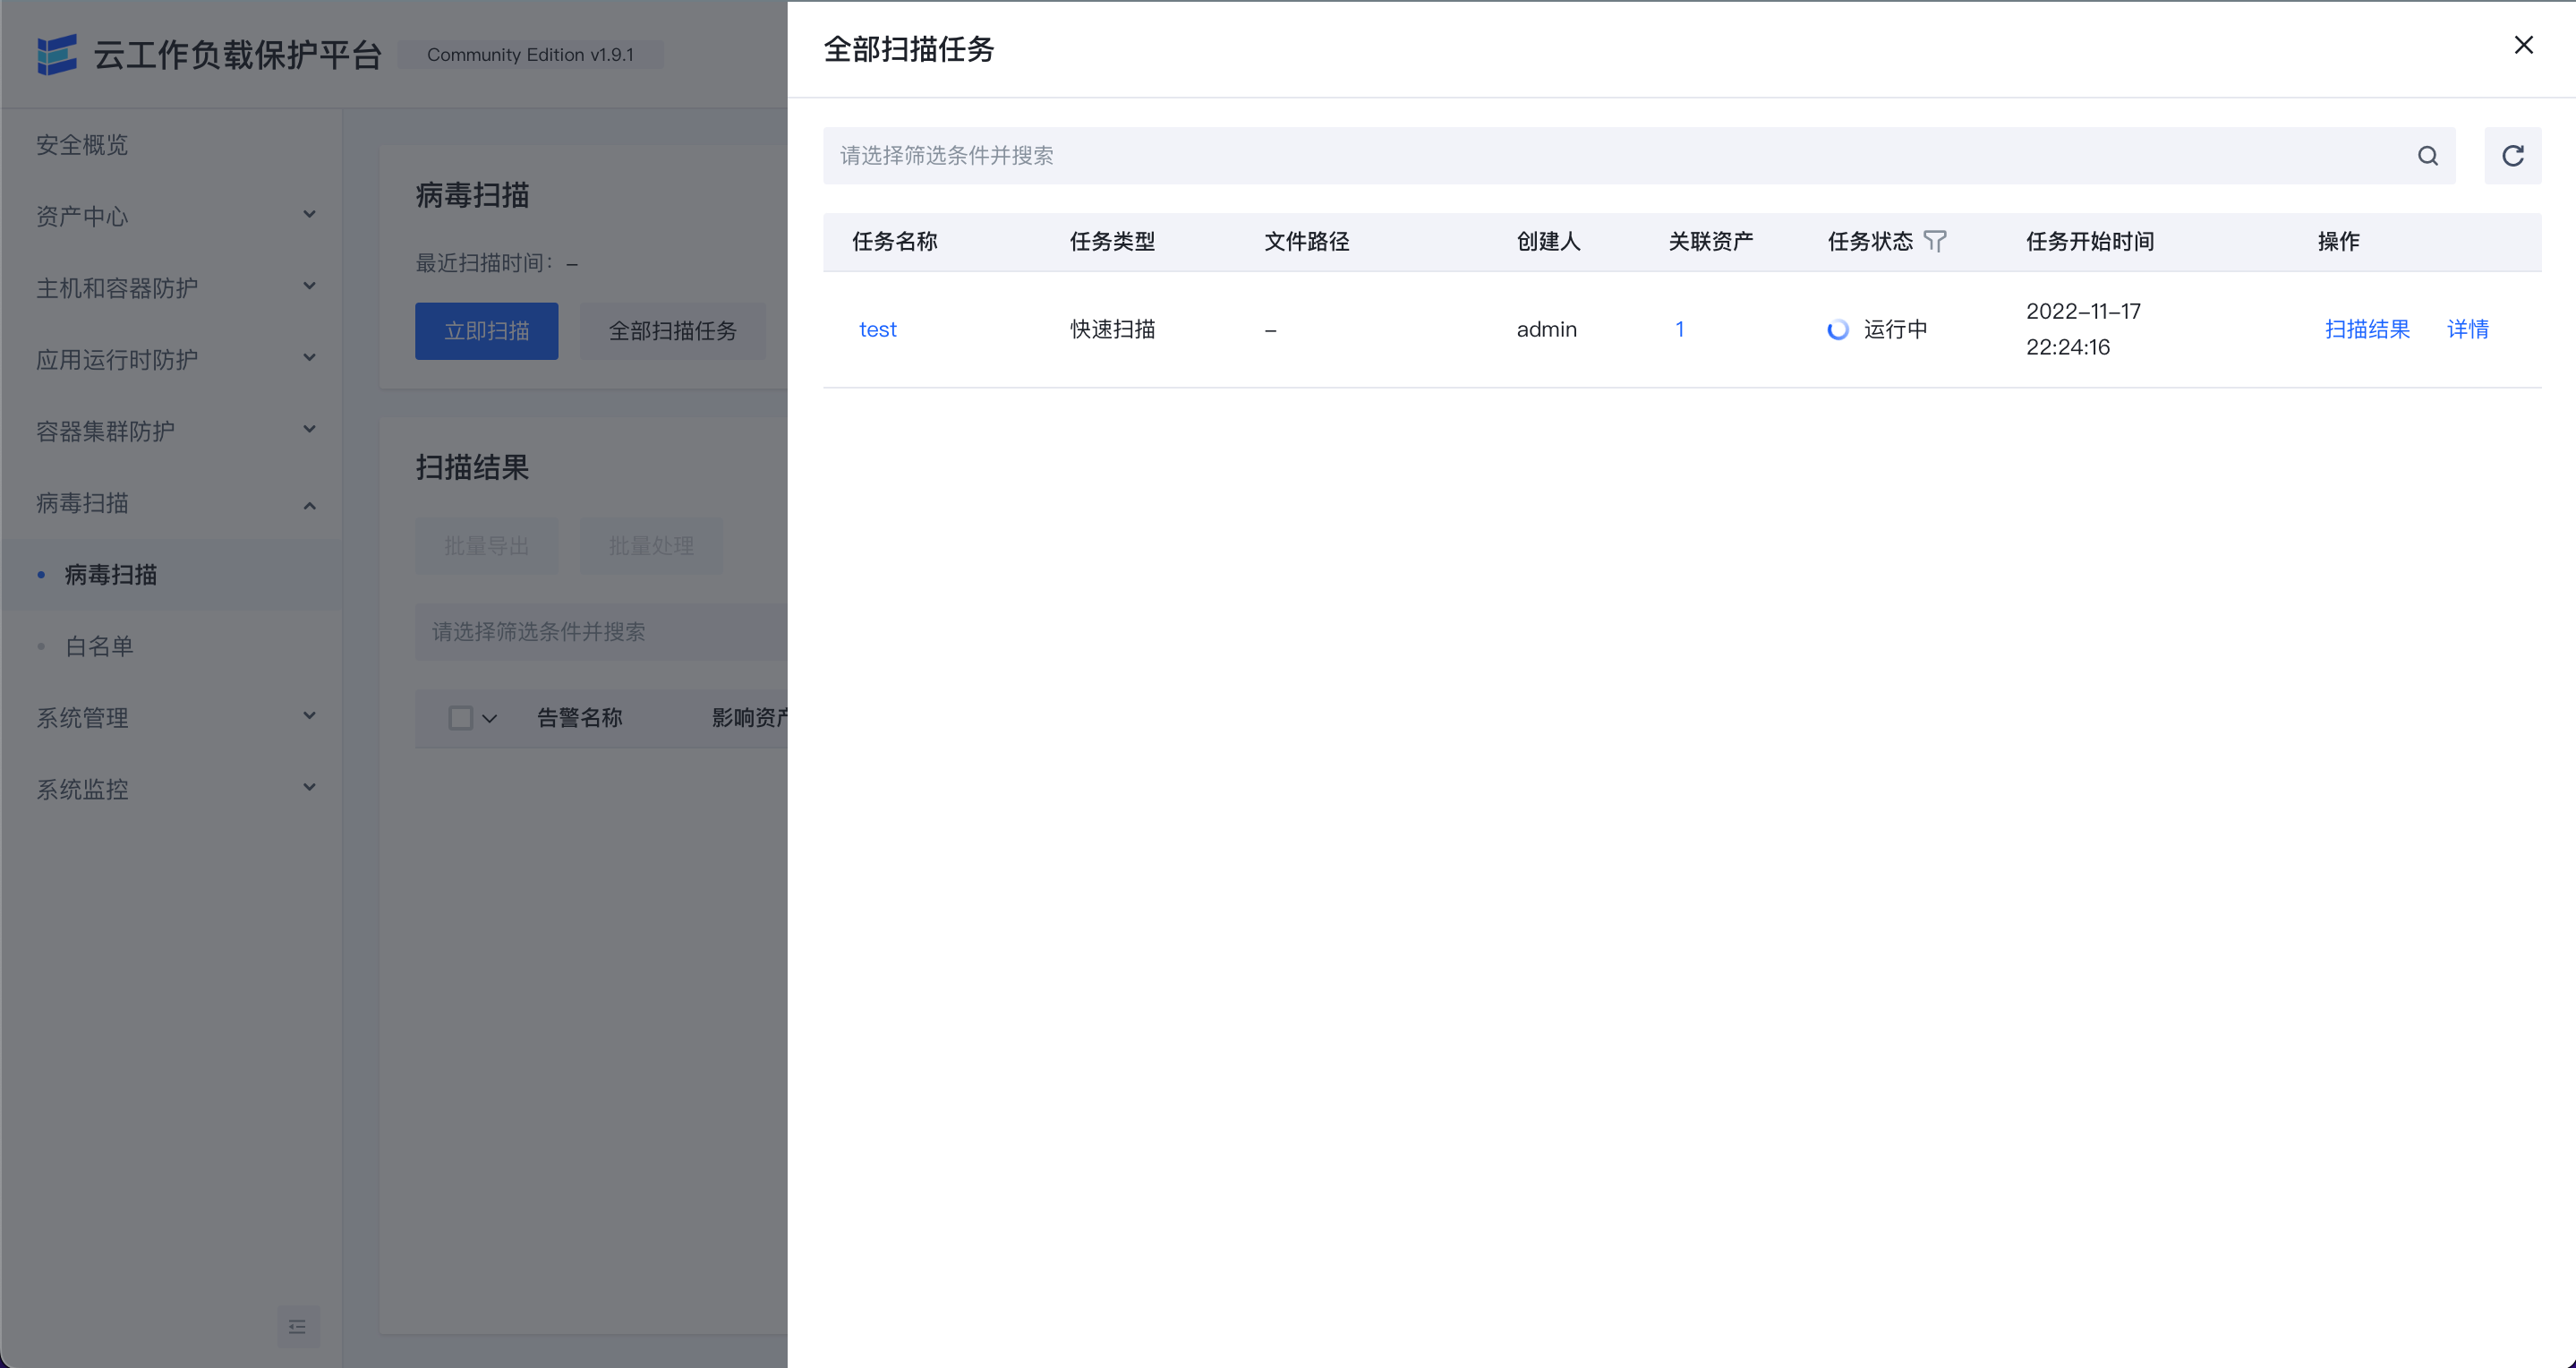
病毒扫描
病毒扫描
显示检测到的病毒文件信息。
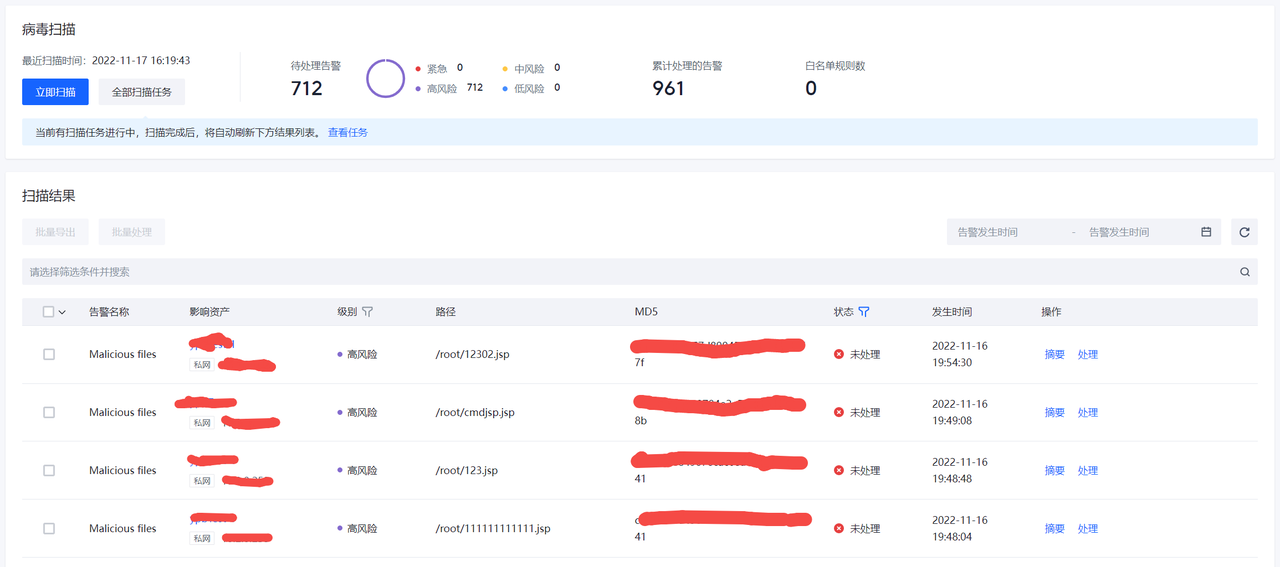
白名单
对病毒检测结果进行过滤的白名单列表。
系统管理
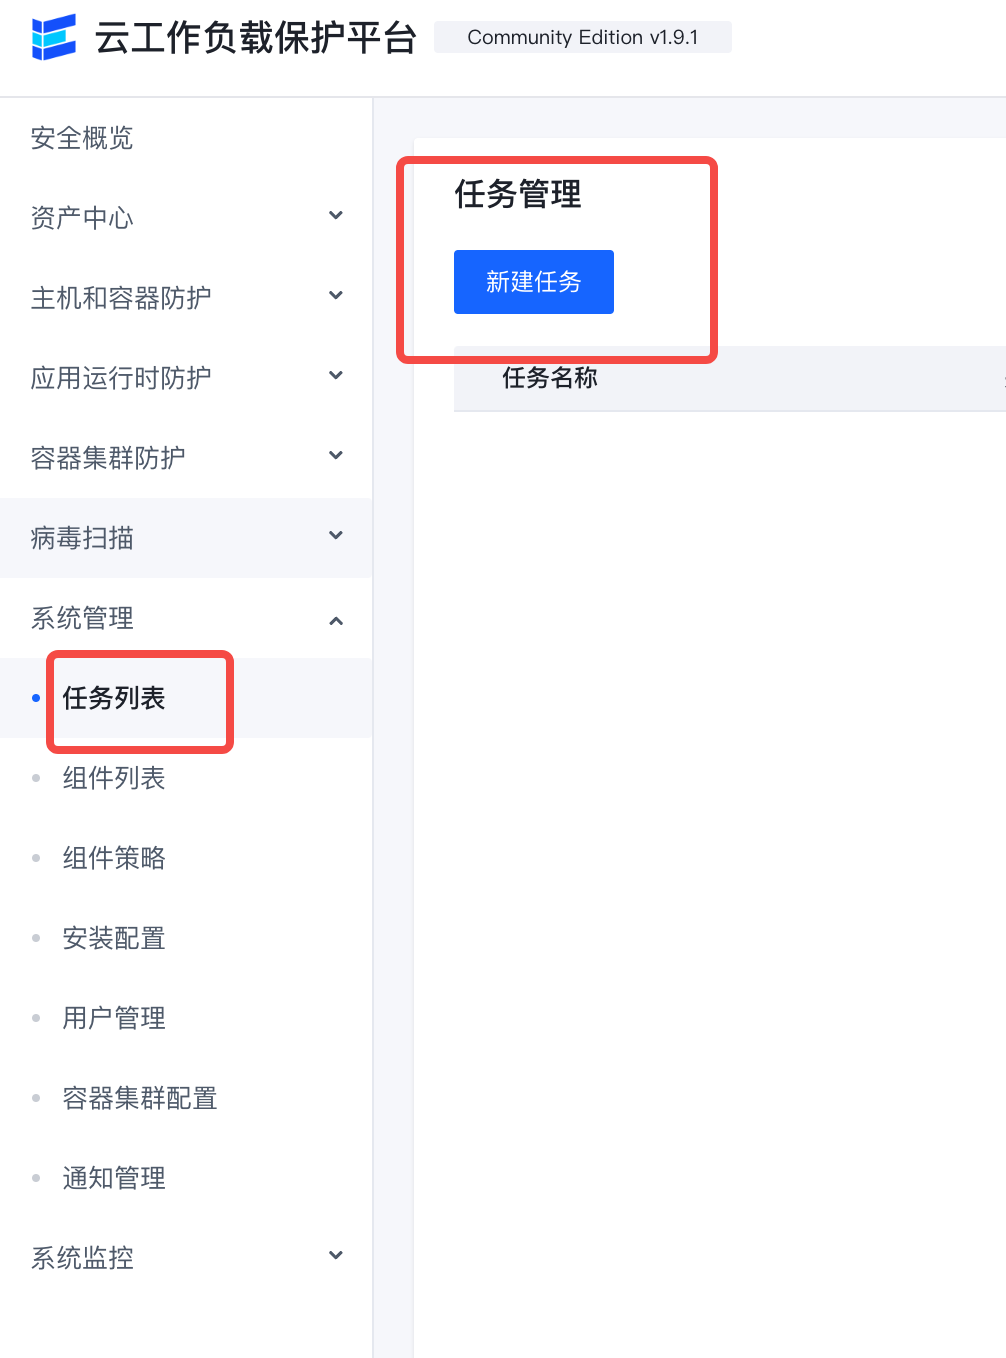
任务管理
该功能主要用于重启客户端、同步配置等管理。
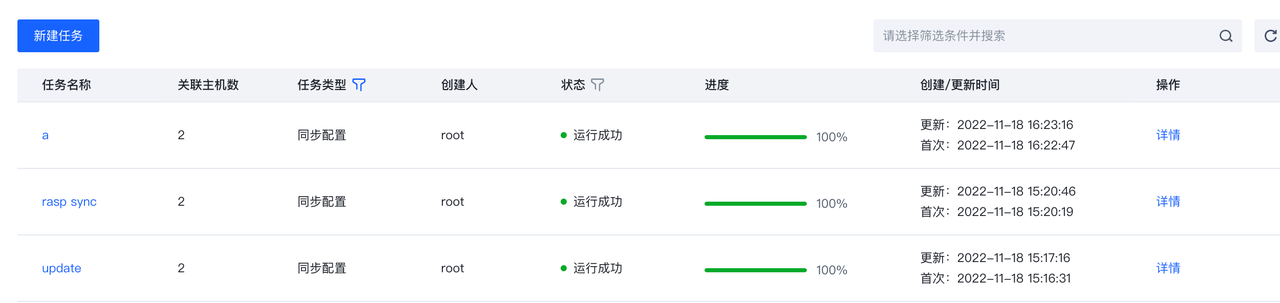
点击”新建任务“,可以进行任务的配置。
除"重启客户端"类型任务外,其他类型任务需要先在"组件管理"和"组件策略"界面进行Agent和插件的配置,才能进行相应操作。
组件管理
用于对Agent和相应插件进行升级配置的管理。
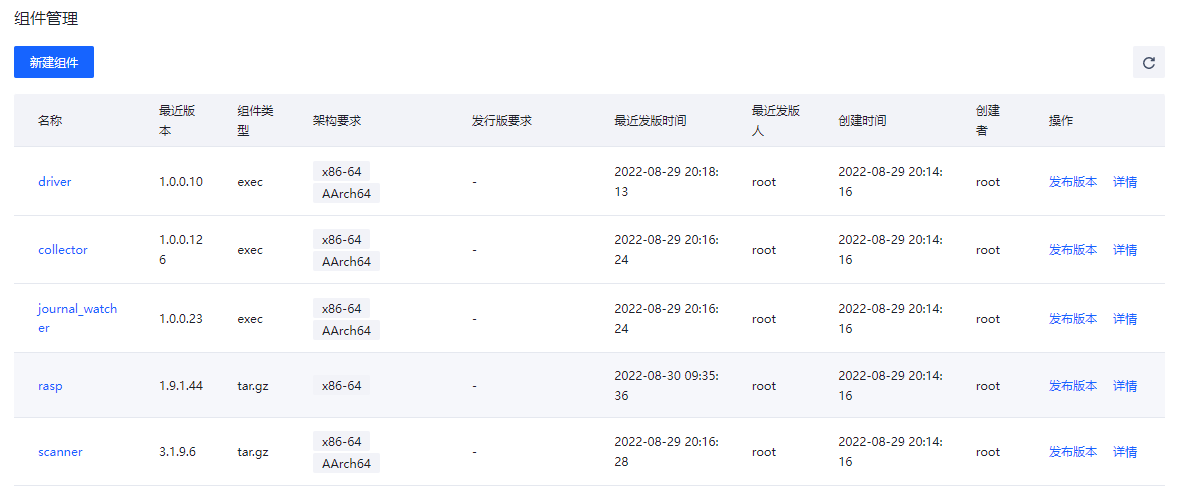
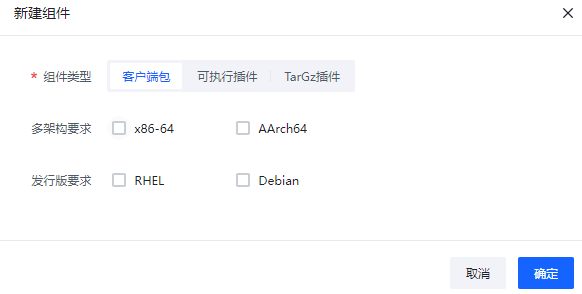
点击”新建组件“可以选择组件的类型是Agent还是插件,然后进行相应配置。
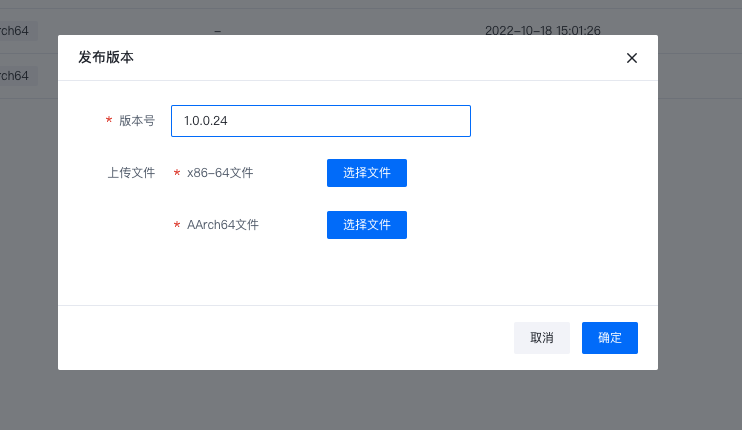
点击发布版本按钮,可以通过上传对应架构与发行版的组件文件生成版本实例。
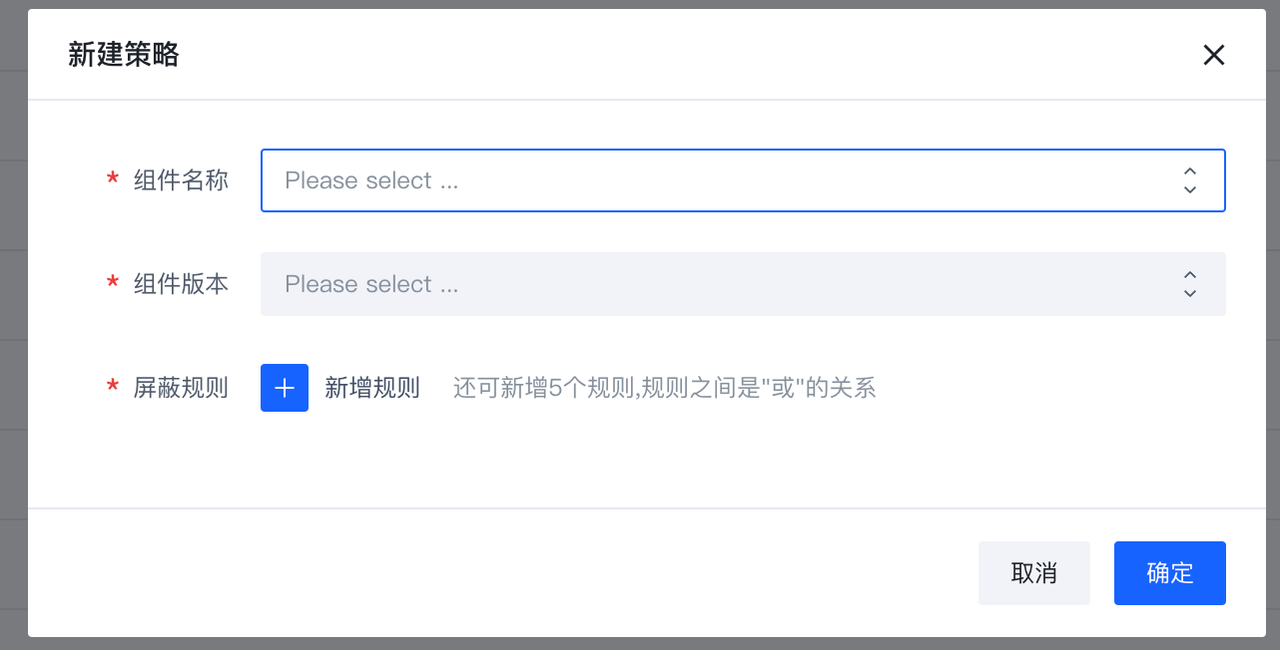
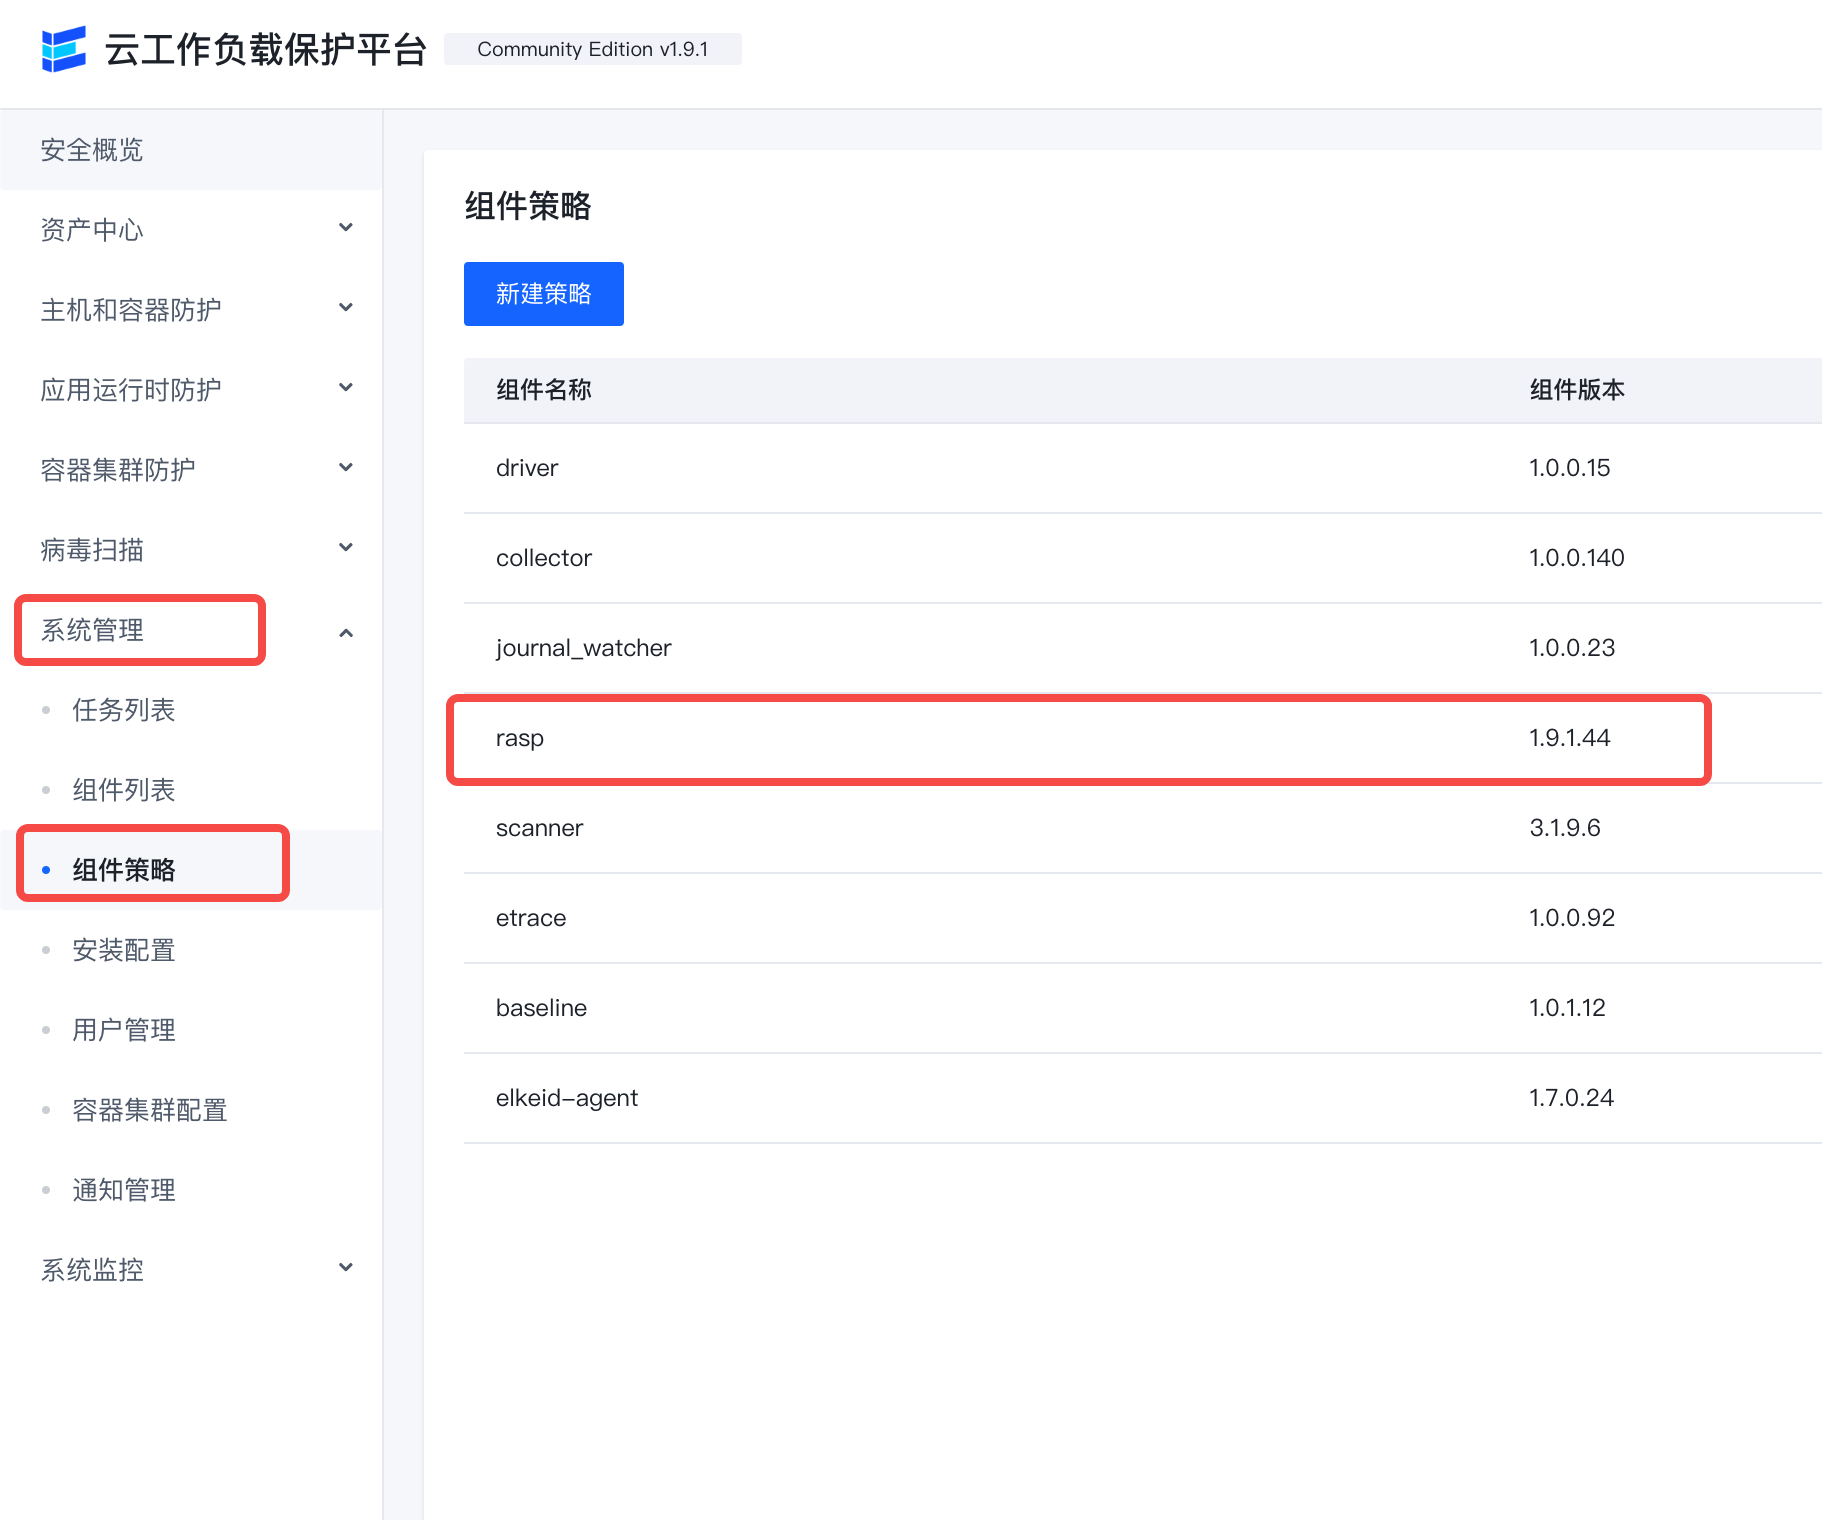
组件策略
通过管理组件策略,调整Agent实际生效的组件版本,进而实现更新、卸载等操作。
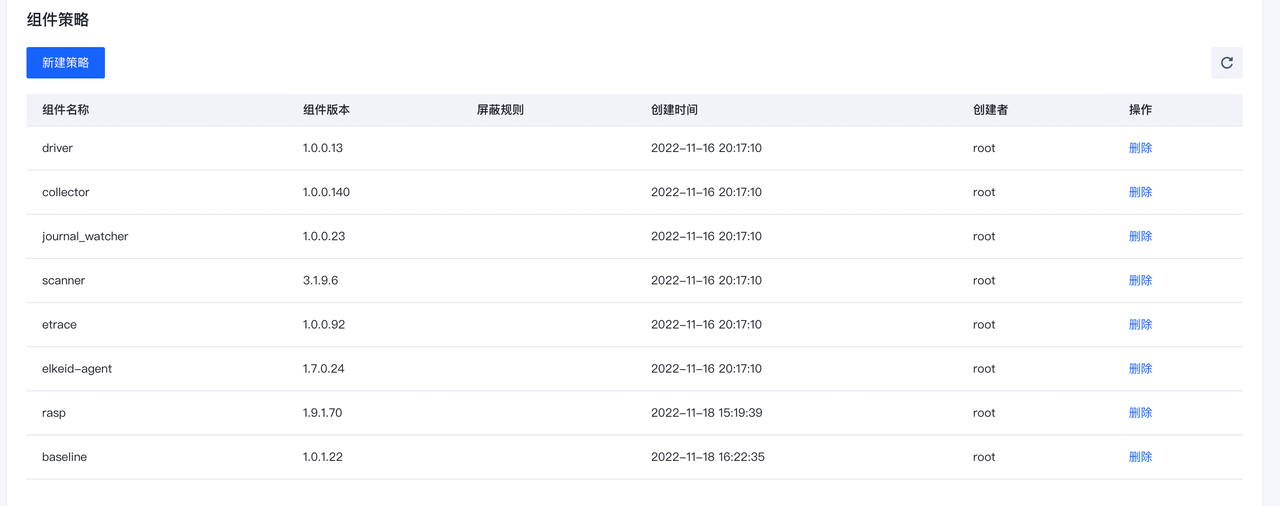
点击新建策略,通过选择组件名称及相匹配的版本,将对应策略添加至策略组中。
通过屏蔽规则使得部分主机不加载(生效)对应组件。
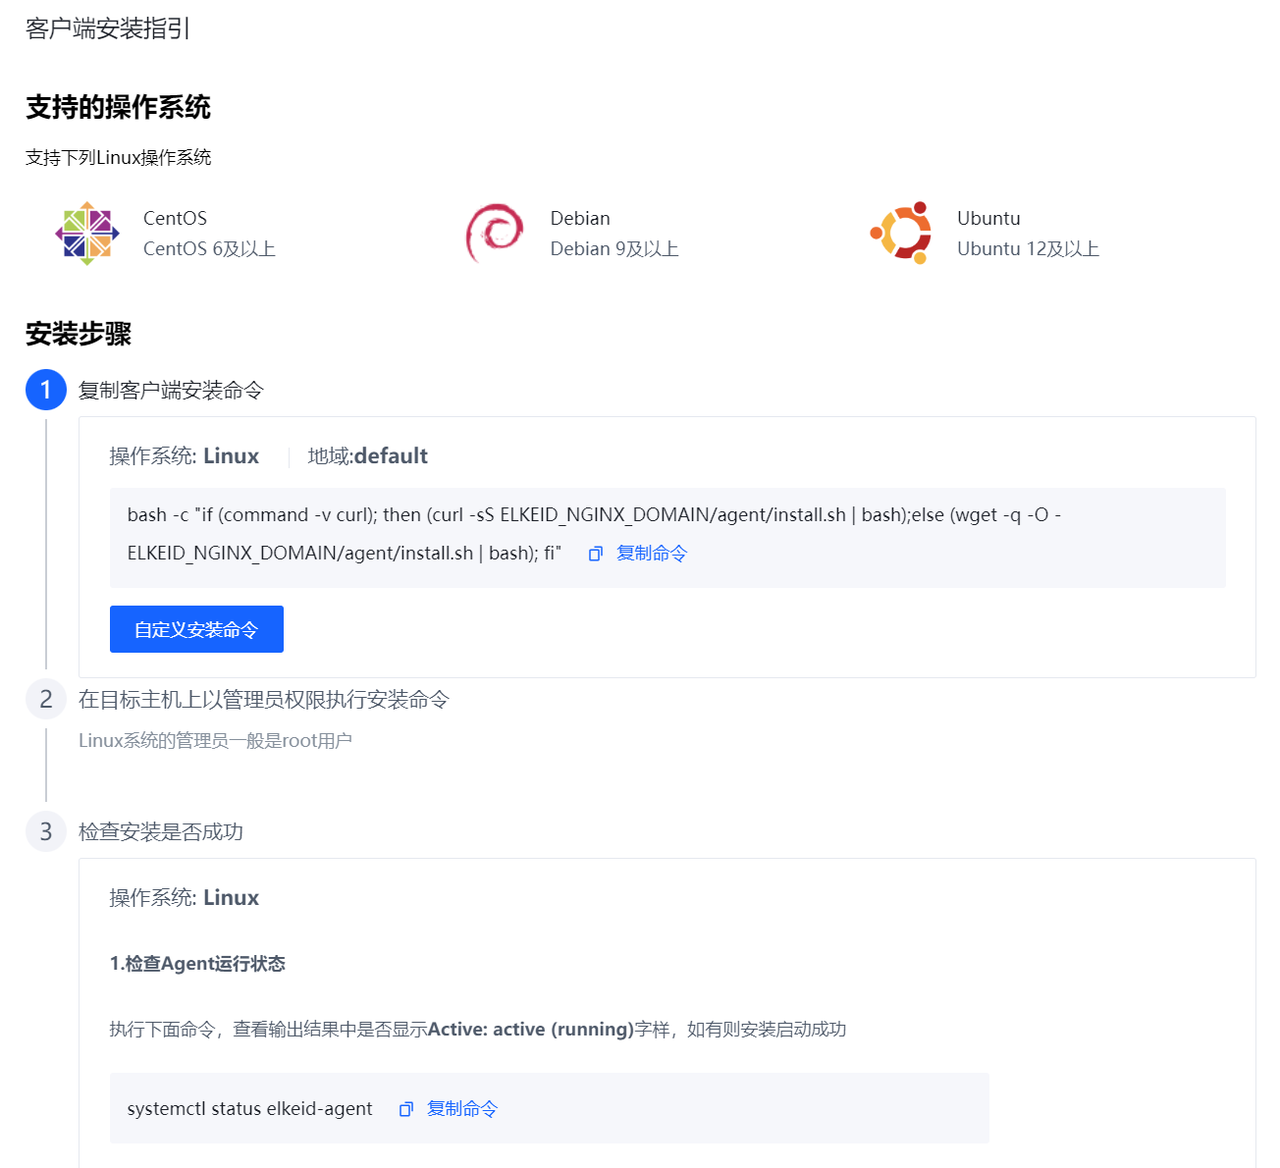
安装配置
可以通过部署帮助来实现Agent的部署和卸载。
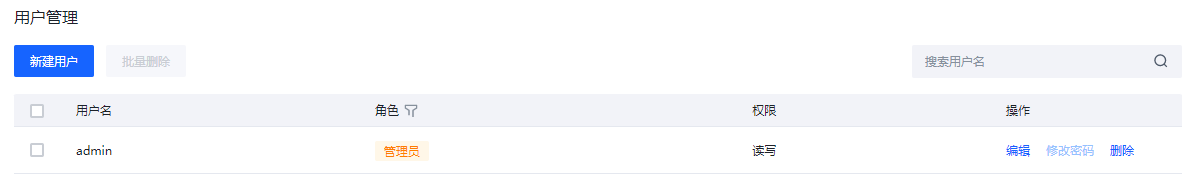
用户管理
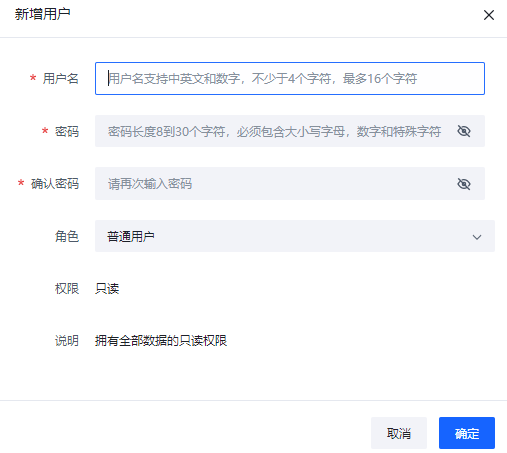
可以在用户管理中对Elkeid Console进行管理,如修改密码,新增与删除用户。
点击"新增用户"可以设置增加新的用户,设置密码的时候请注意密码强度的要求。
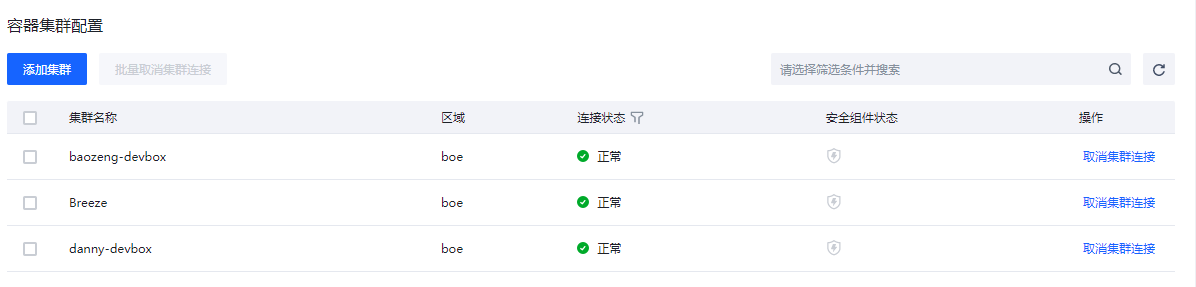
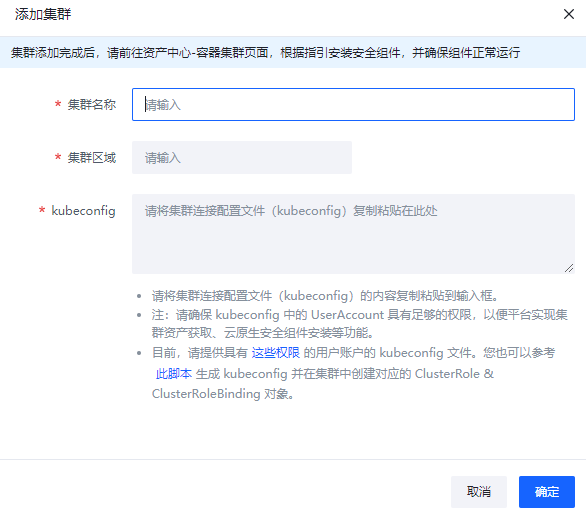
容器集群配置
进行容器集群防护能力接入的配置。
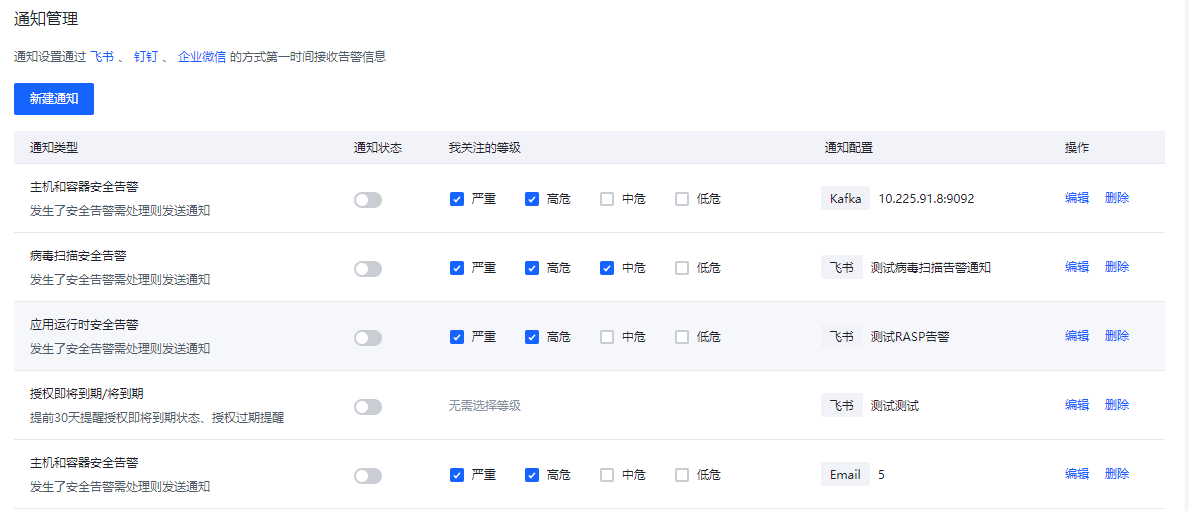
通知管理
告警通知以及过期通知的配置管理,支持飞书,钉钉等。
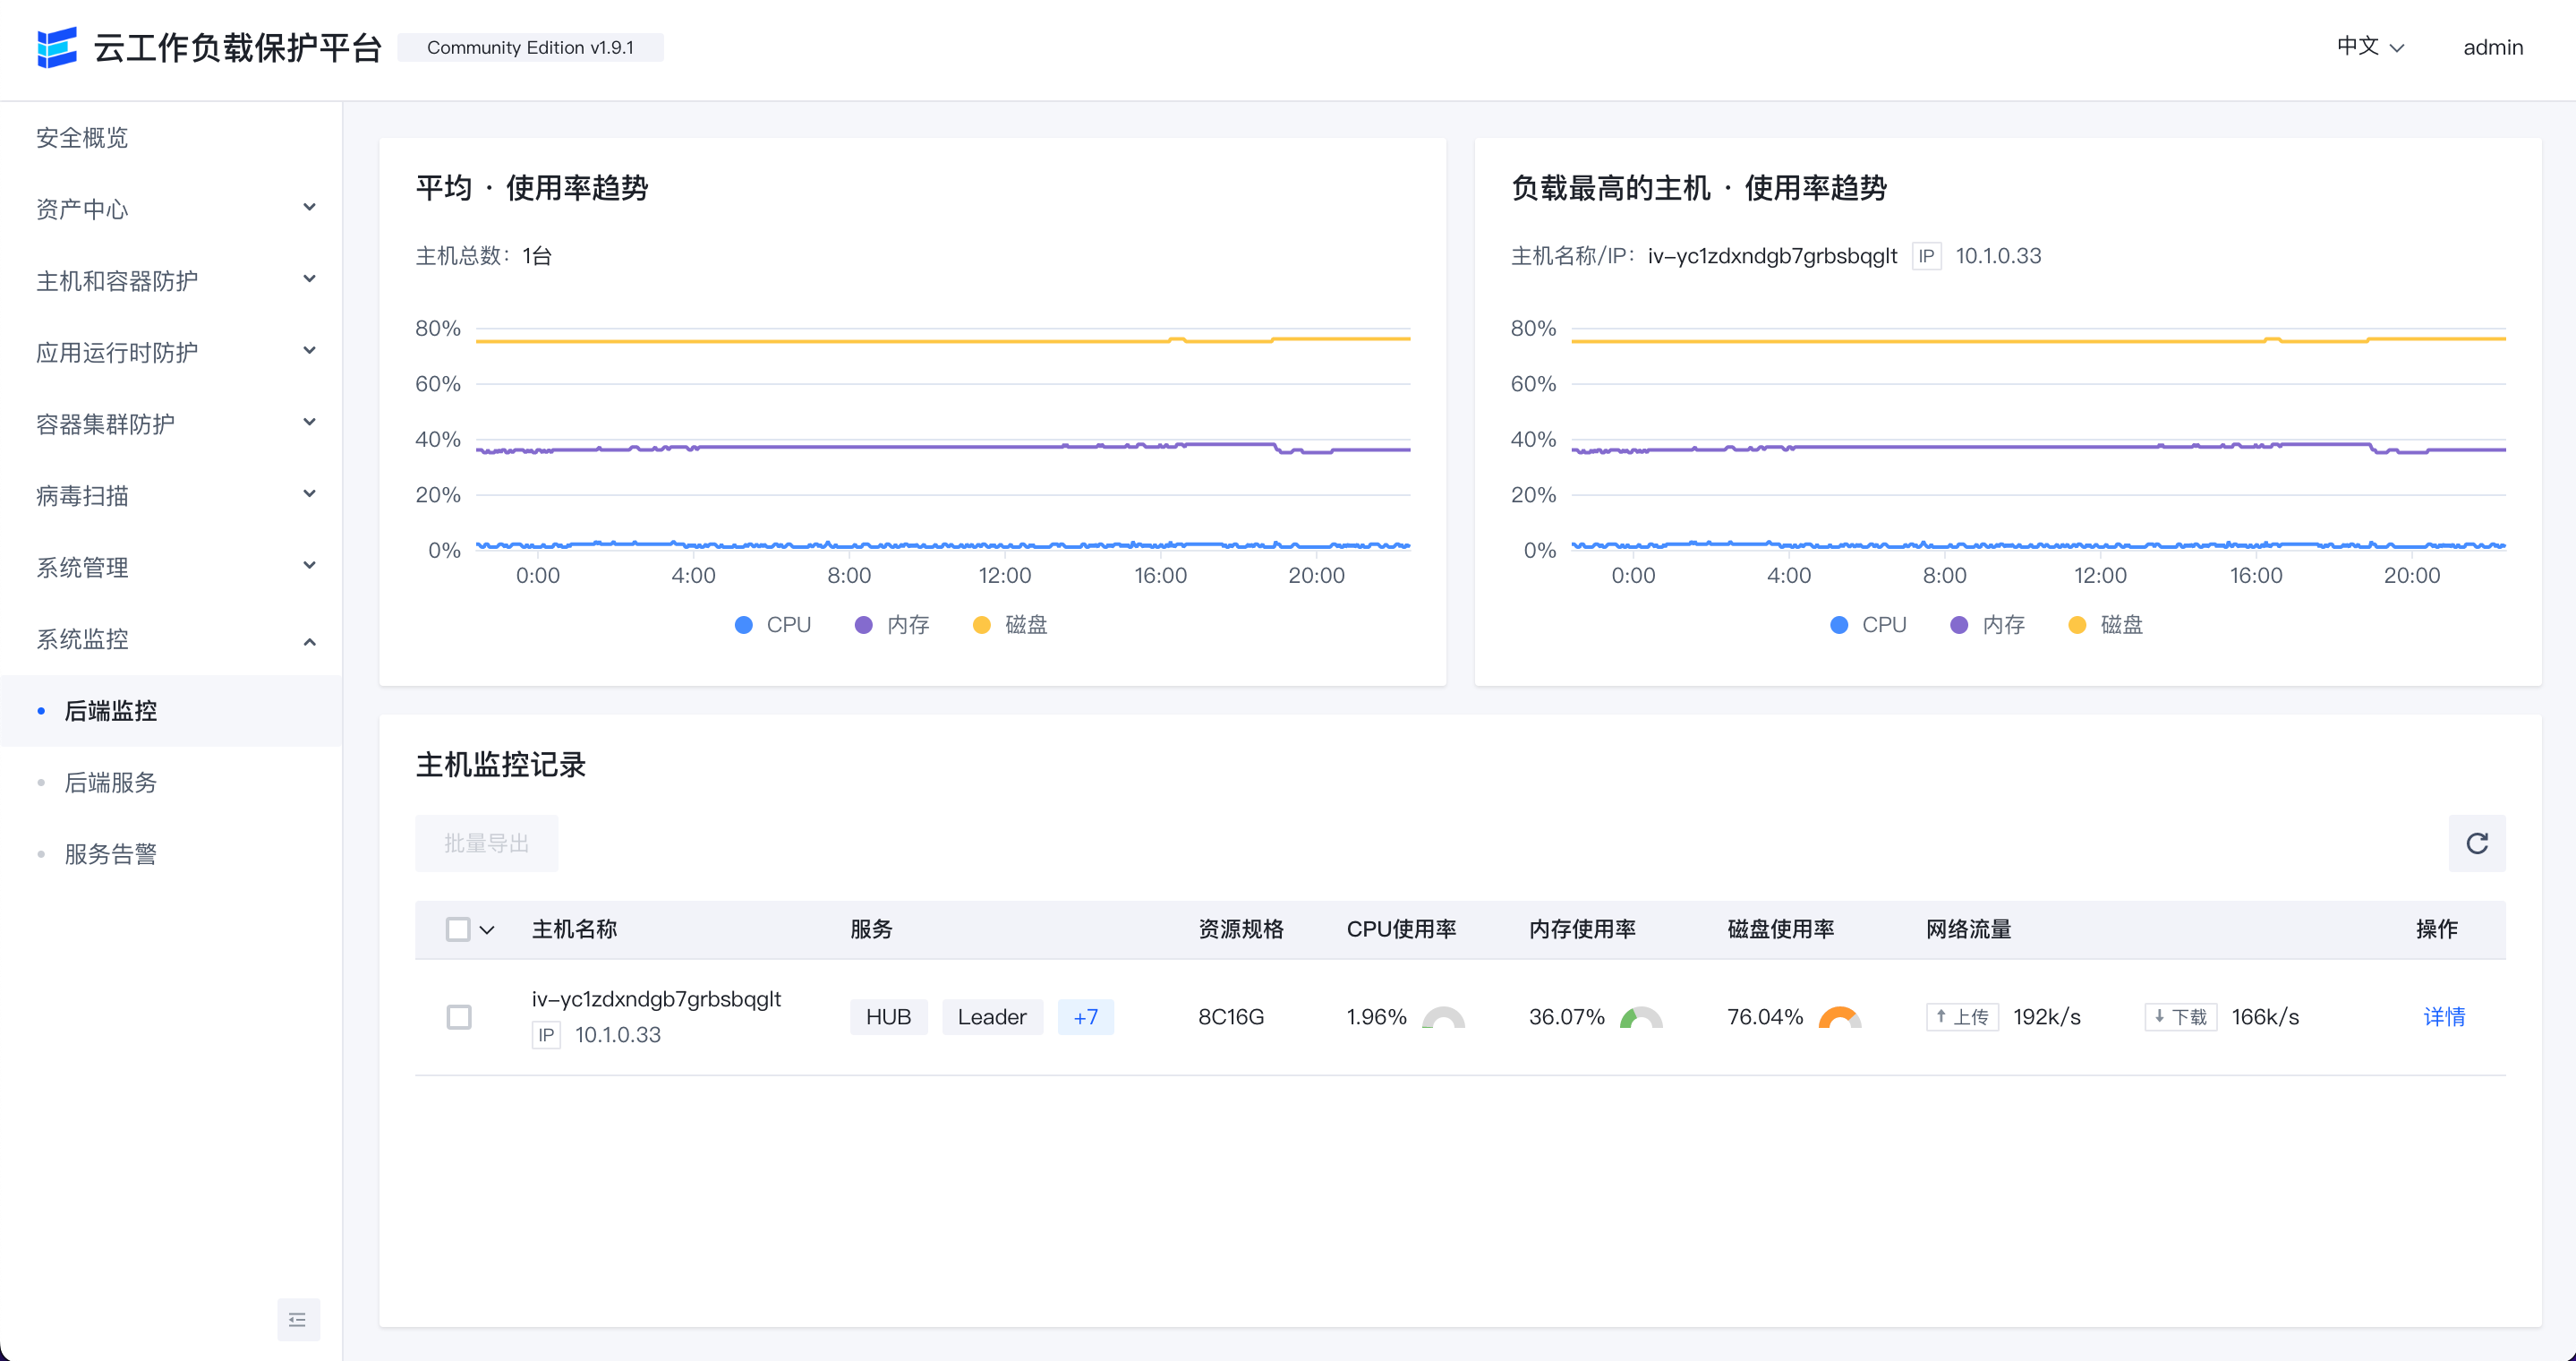
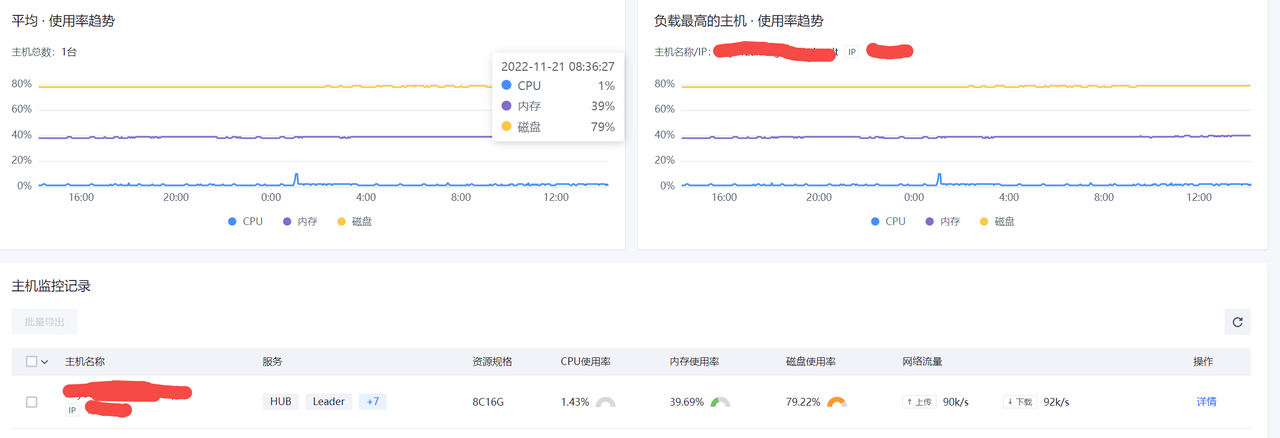
系统监控
后端监控
查看后端服务所在主机的CPU,内存,磁盘和网络流量等使用情况。
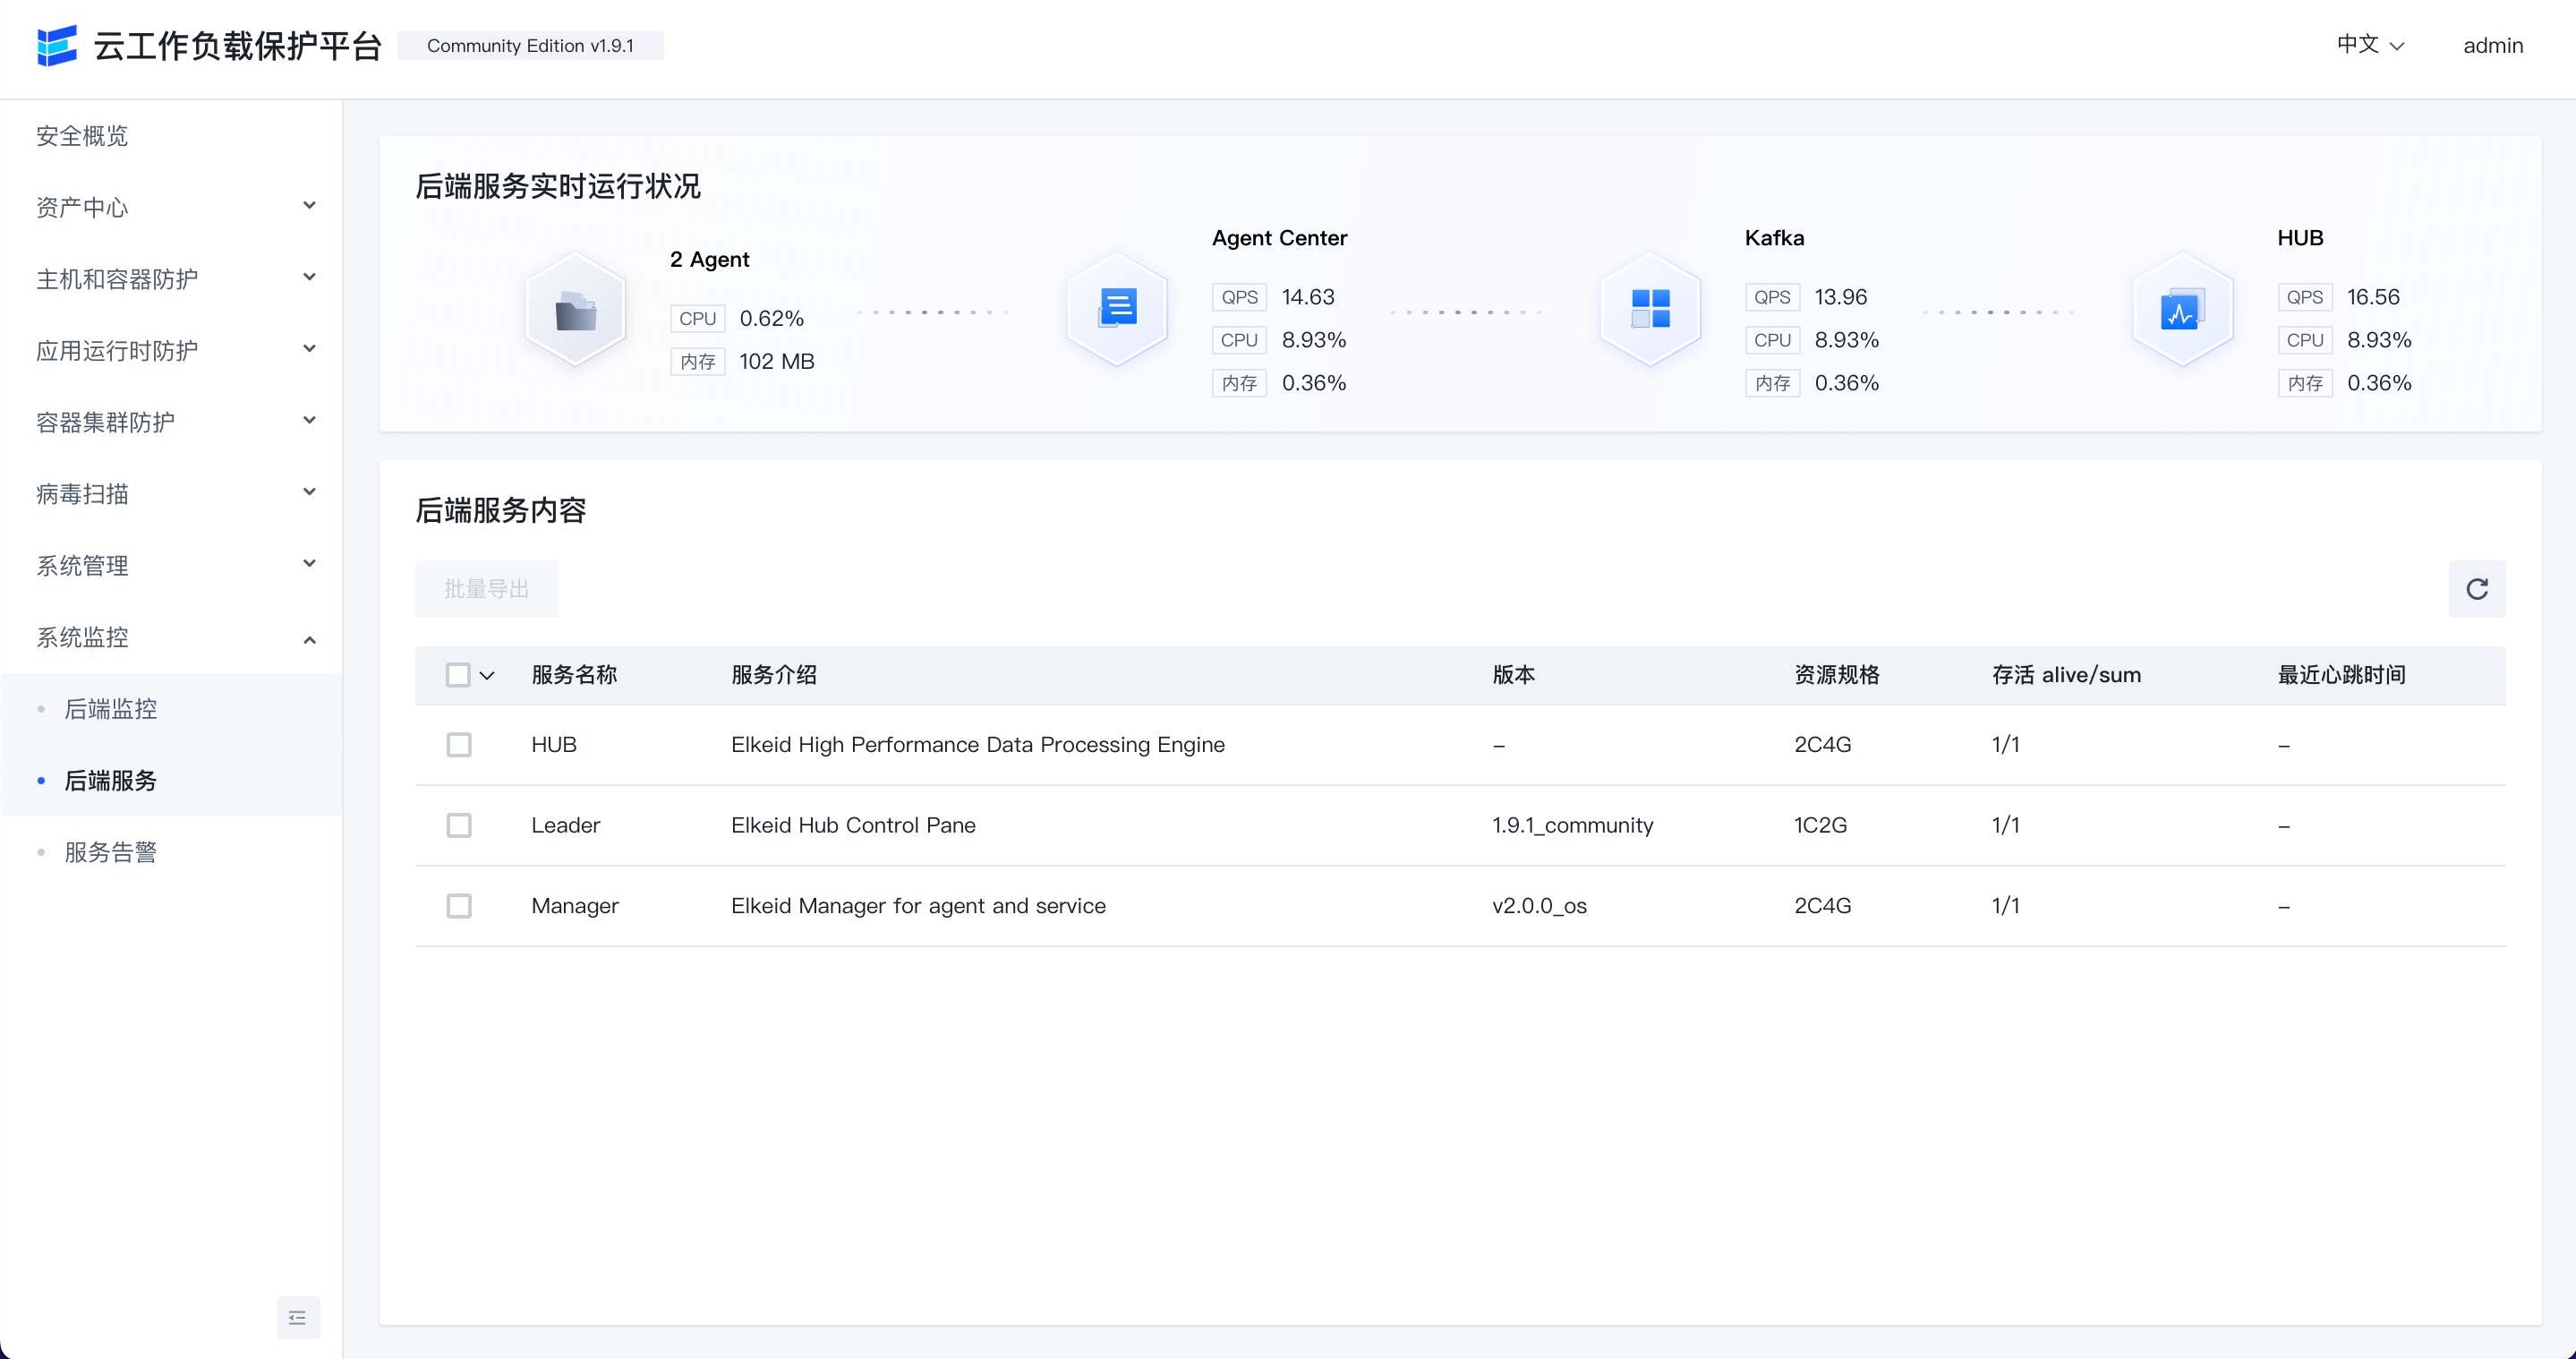
后端服务
查看后端各服务模块的QPS,CPU和内存的使用情况。
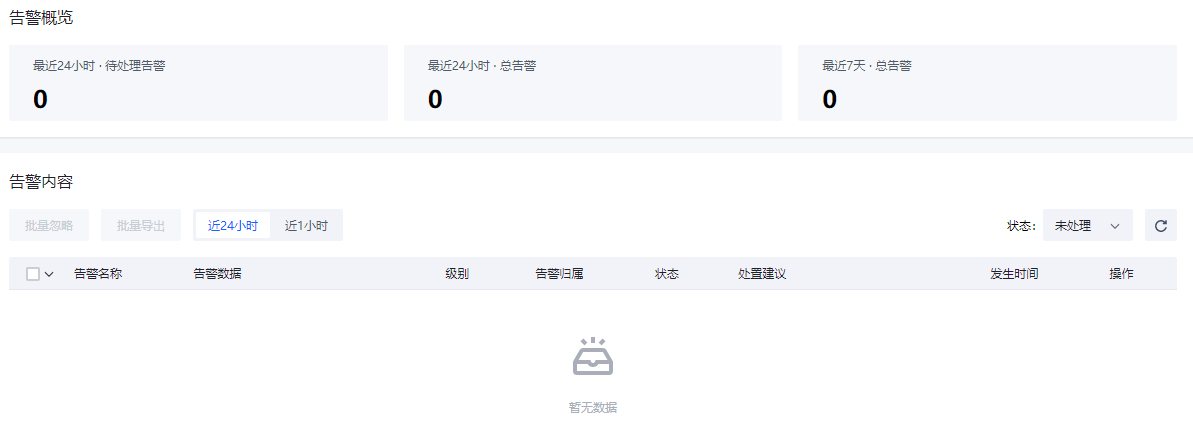
服务告警
显示最近1小时/24小时发现的服务异常告警。
Elkeid HUB 社区版快速上手教程
本教程的前置条件
在开始本教程之前,请检查:
- 已经按照部署文档,使用elkeidup正确部署了 HUB。
- 至少有一个可以使用的数据输入源(Input)和数据存储的输出源(Output)。在HIDS场景中,数据输入源为 AgentCenter 配置文件中指定的 kafka ,输出源可以使用 ES 或 Kafka ,本教程中以 ES 为例。
e.g. 社区版默认已配置输入源(hids,k8s)可在前端看到,方便测试使用
Step 1. 访问并登录前端
使用部署前端机器的 IP 即可访问前端,登录信息为elkeidup部署创建的用户名和密码。
Step 2. 编写策略
基本概念介绍
RuleSet是HUB实现检测/响应的核心部分,可以根据业务需要对输入的数据进行检测响应,配合插件还能实现报警的直接推送或对消息的进一步处理。因此如果有额外的业务需要可能需要自行编写部分规则。
RuleSet是通过XML格式来描述的规则集,RuleSet分为两种类型rule 和 whitelist。rule为如果检测到会继续向后传递,whitelist则为检测到不向后传递,向后传递相当于检出,因此whitelist一般用于白名单。
Ruleset里可以包含一条或多条rule,多个rule之间的关系是'或'的关系,即如果一条数据可以同时命中多条rule。
使用前端编写规则
进入规则页->规则集页面,可以看到当前收藏的RuleSet和全部RuleSet。
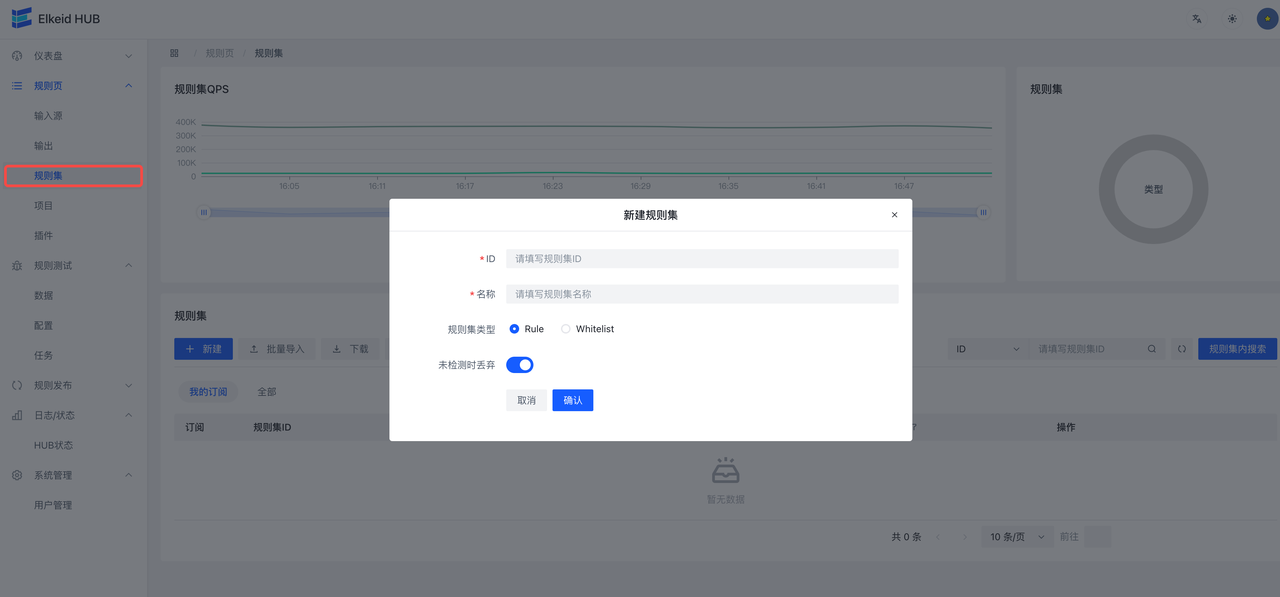
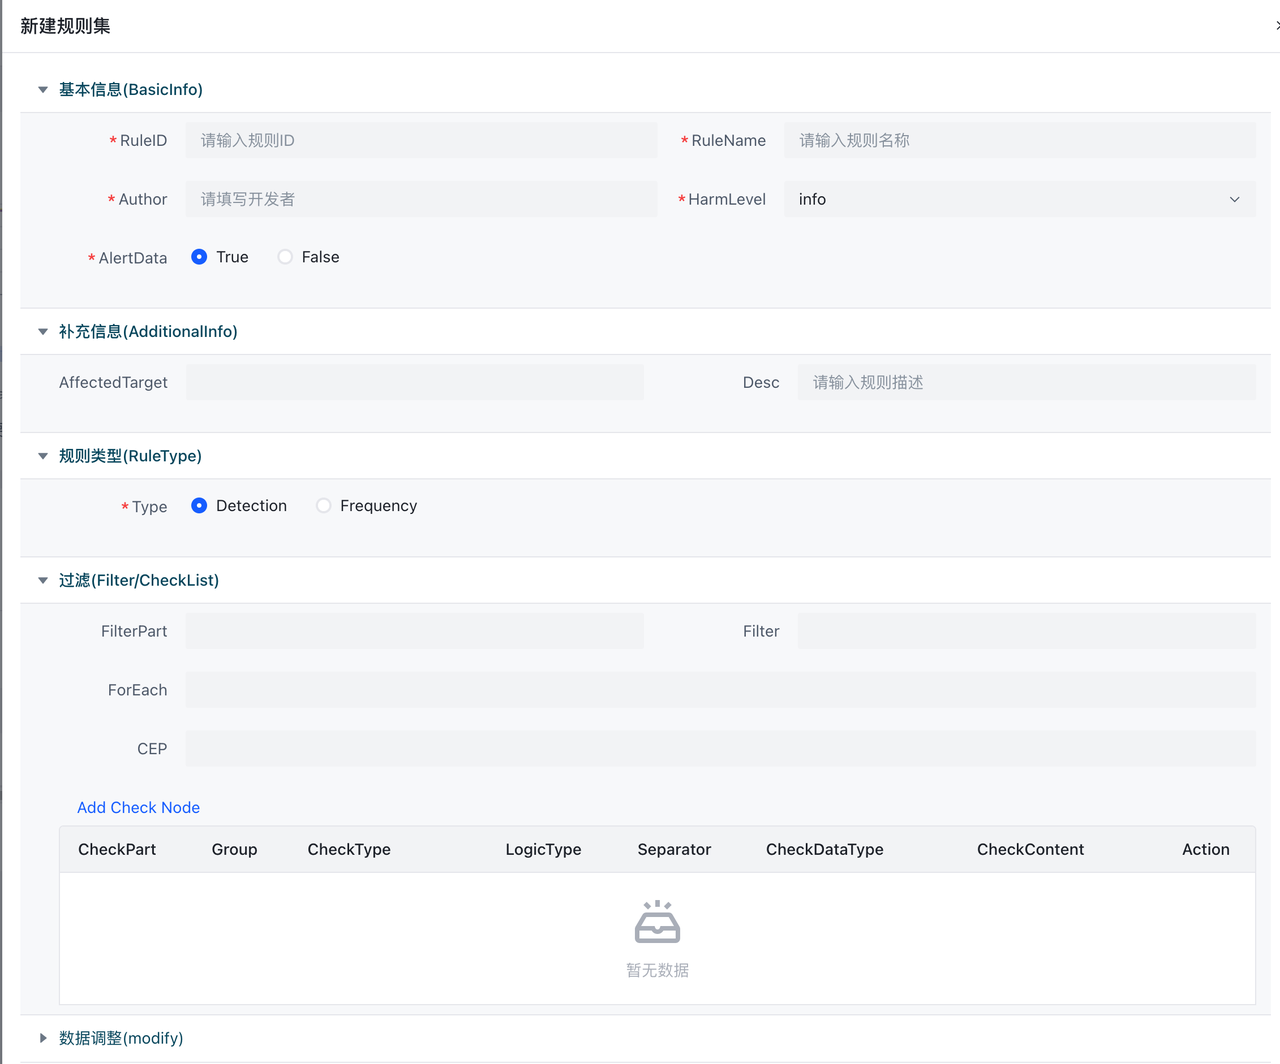
当Type为Rule时会出现未检测时丢弃字段,意味未检测到是否丢弃,默认是True即为未检测到即丢弃,不向下传递,在这里我们设为True。创建完成后,在创建好的条目上点击规则按钮,进入该Ruleset详情。在RuleSet详情中点击新建会弹出表单编辑器。
HUB已经默认开放了数十条规则,可以查看已经编写的规则,进行相关策略编写
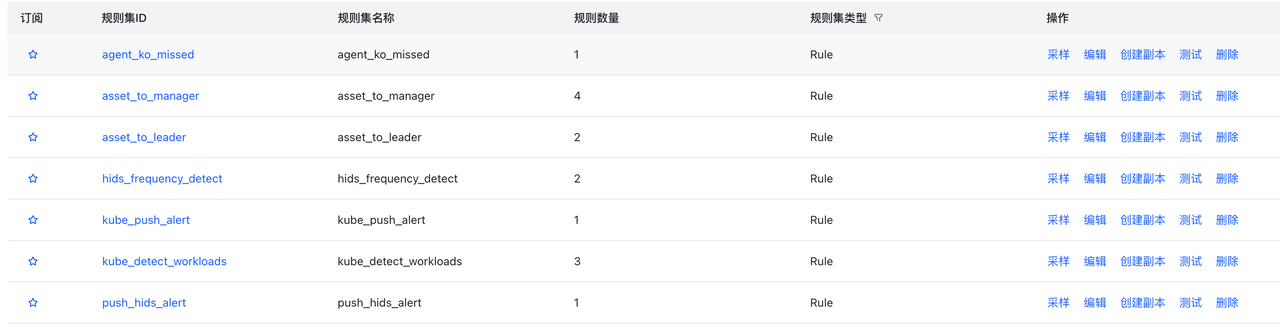
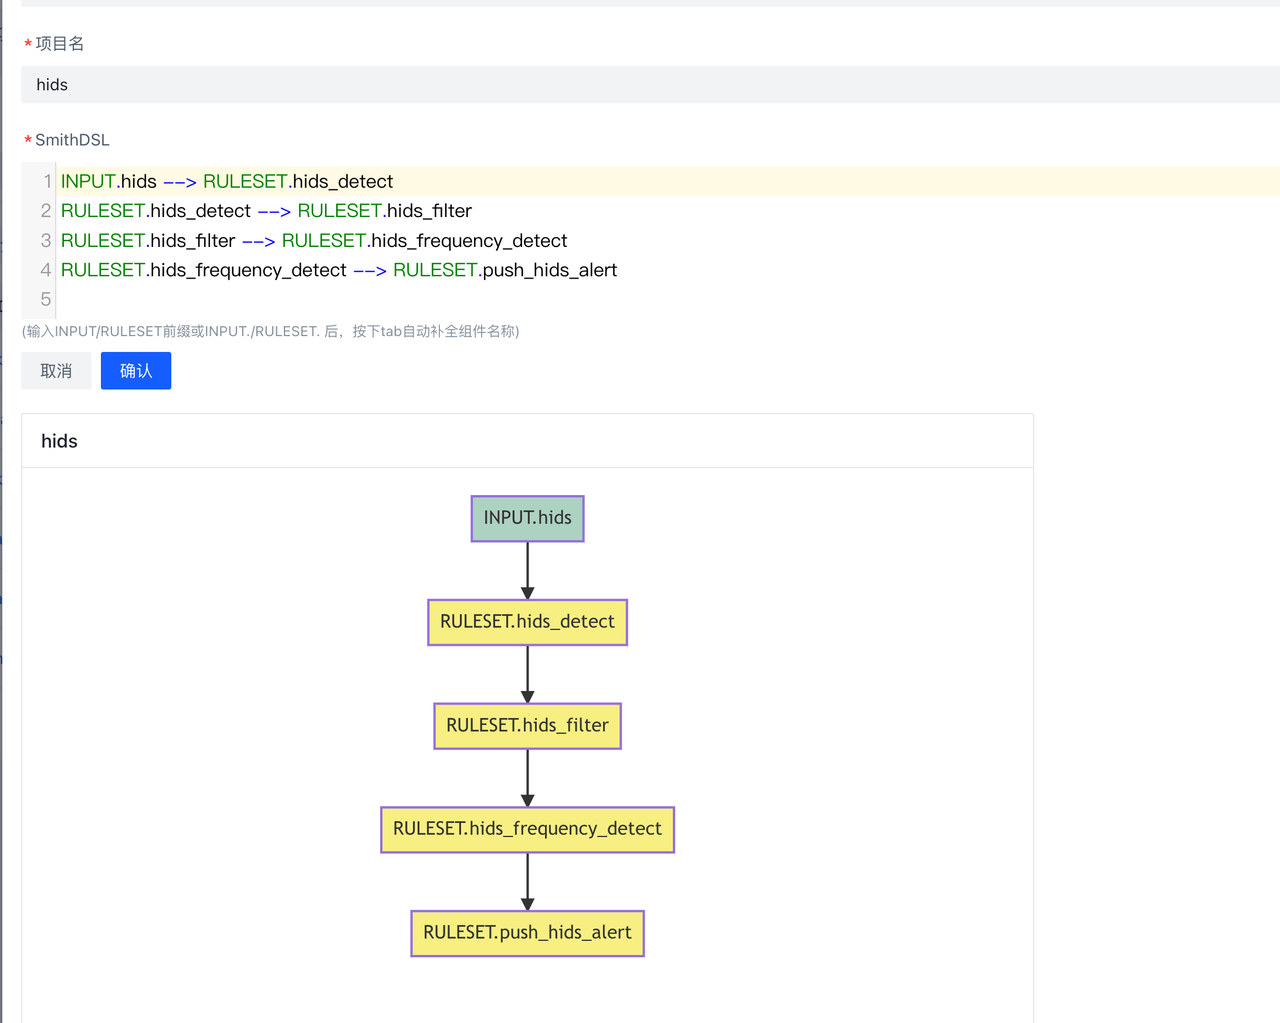
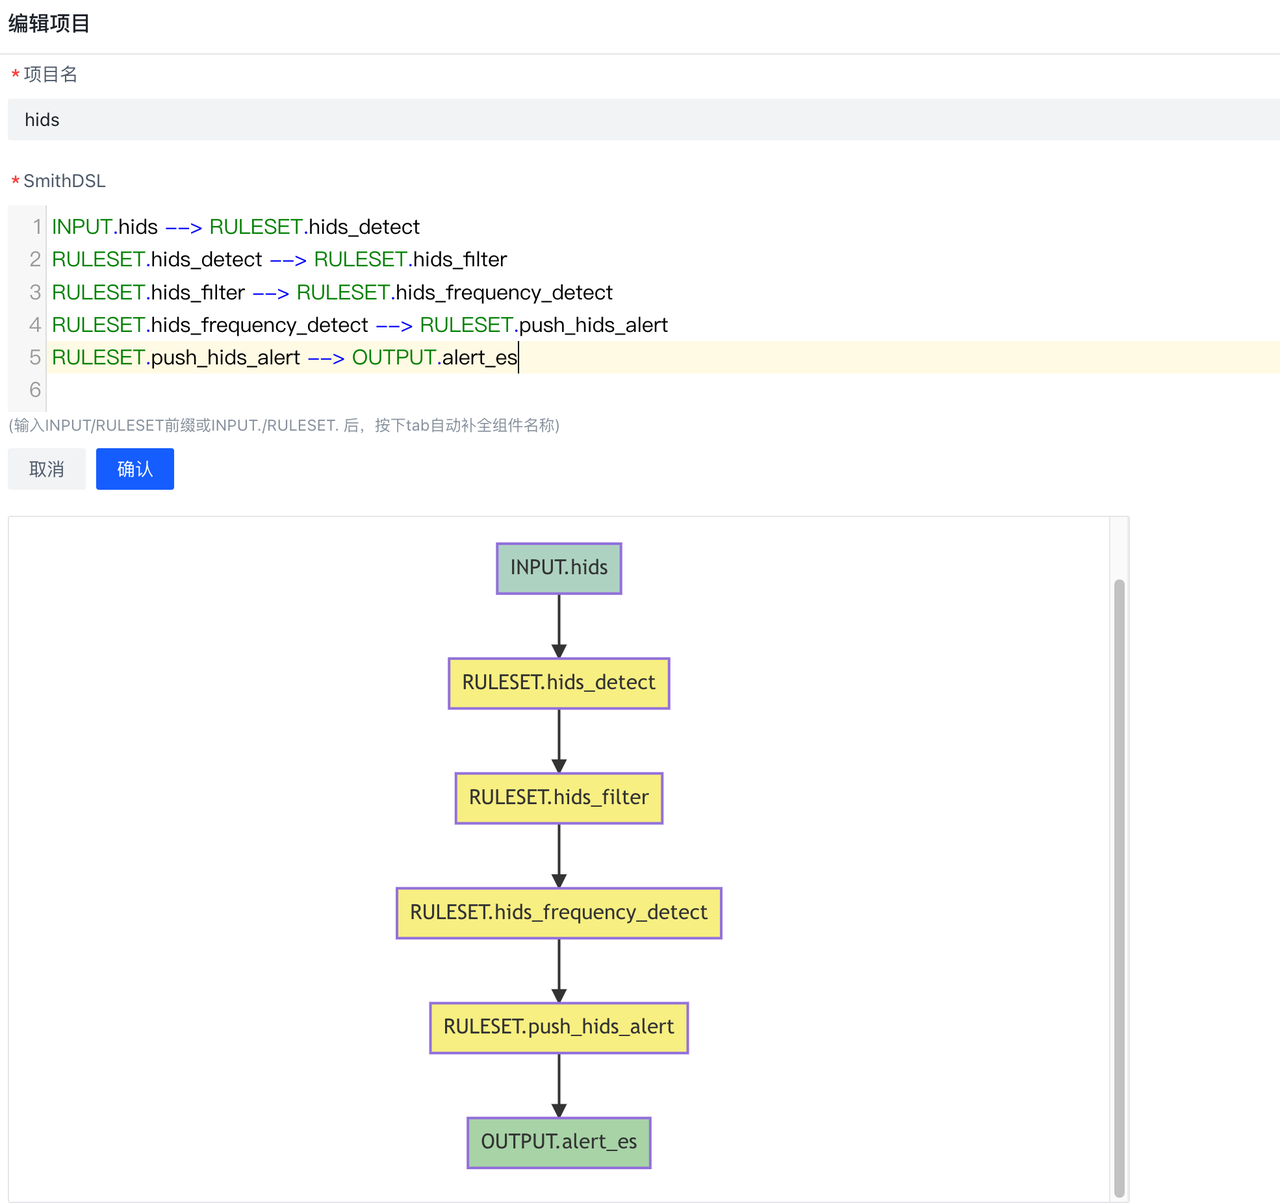
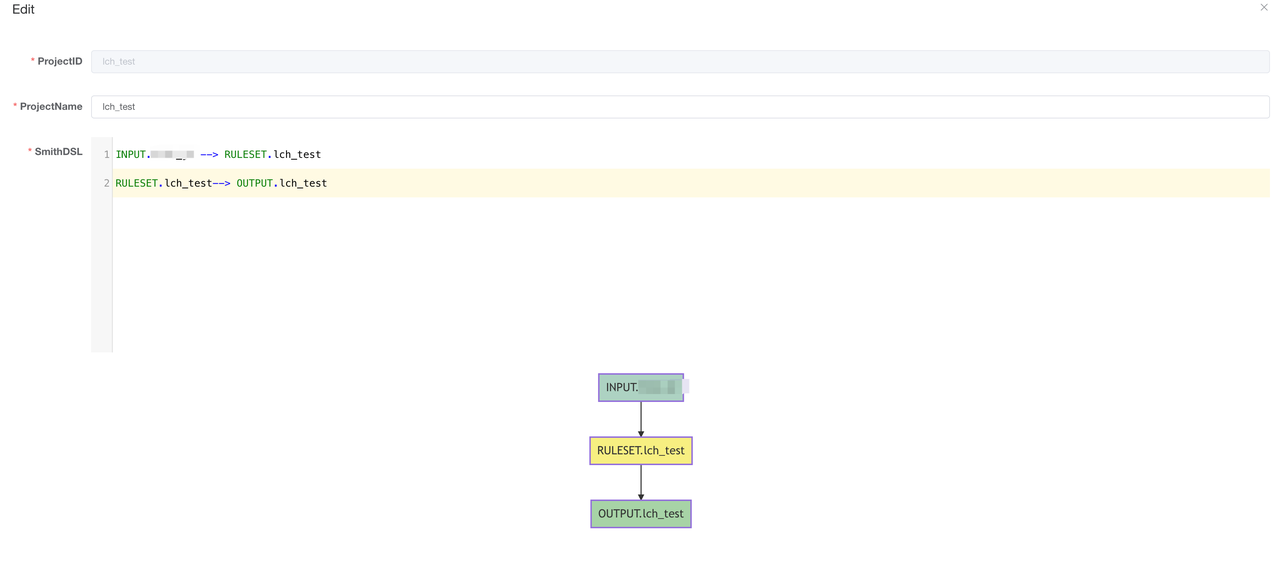
也可以根据Elkeid HUB 社区版使用手册 进行编写.编写完成后,可以在项目页新建project,将编写好的规则与输入输出进行组合.
下图即为hids告警处理的过程:数据按照dsl的顺序,依次经过RULESET.hids_detect、RULESET.hids_filter等规则进行处理,最后再通过RULESET.push_hids_alert推送到CWPP console.
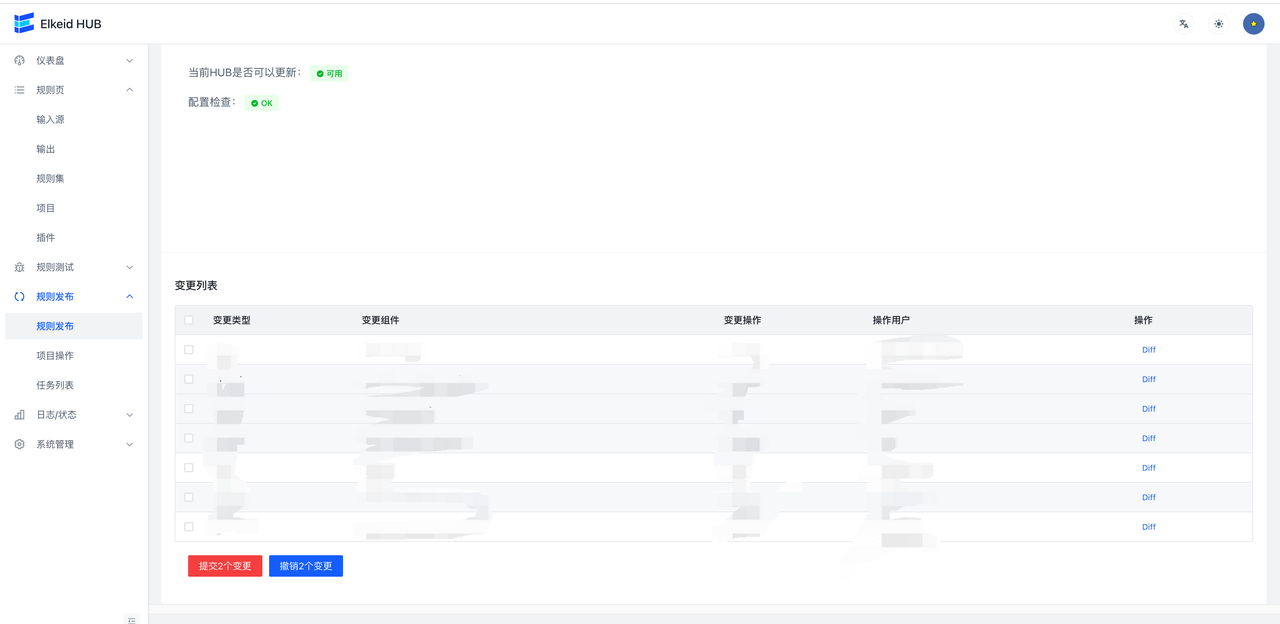
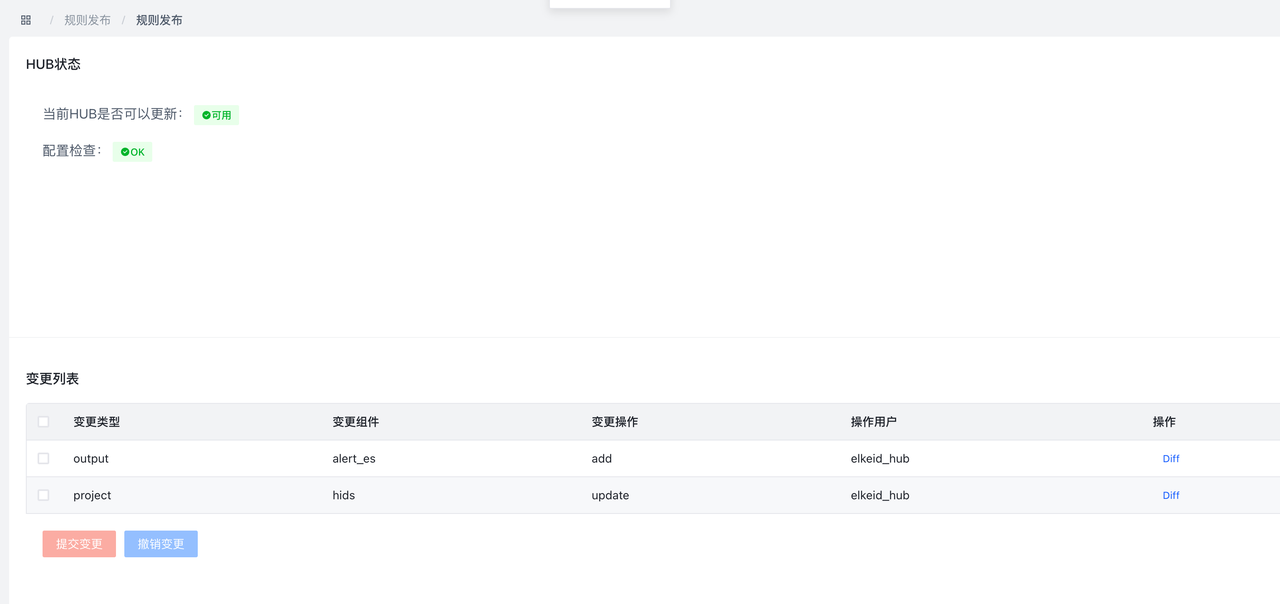
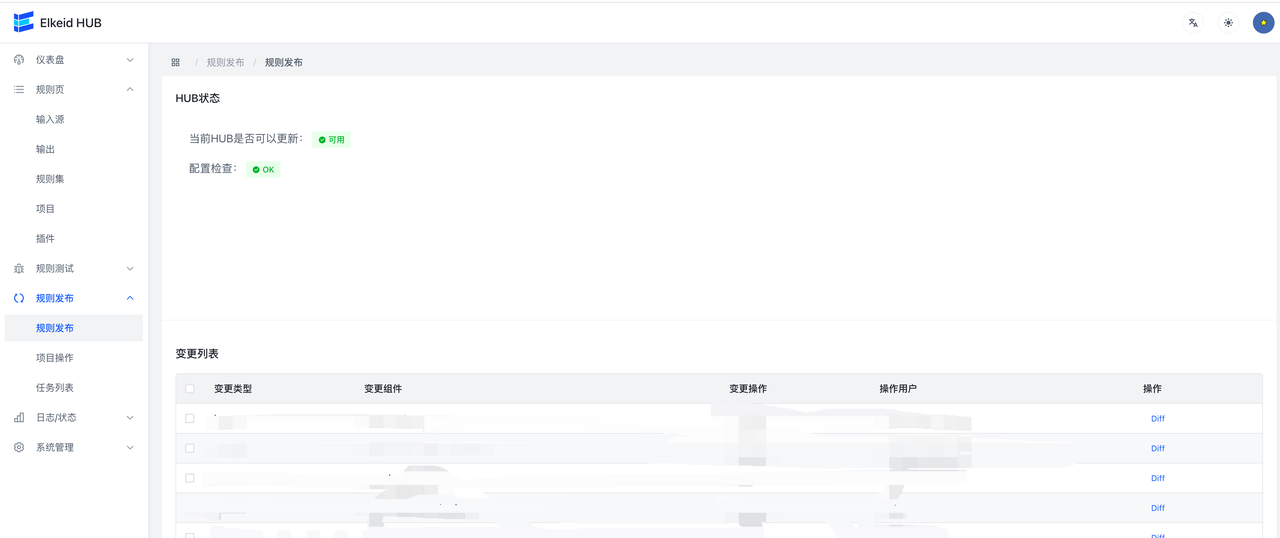
完成以上步骤后,进入规则发布页面,会显示出刚才修改的全部内容,每一个条目对应着一个组件修改,点击 Diff 可以查看修改详情。检查无误后,点击提交,将变更下发到HUB集群。
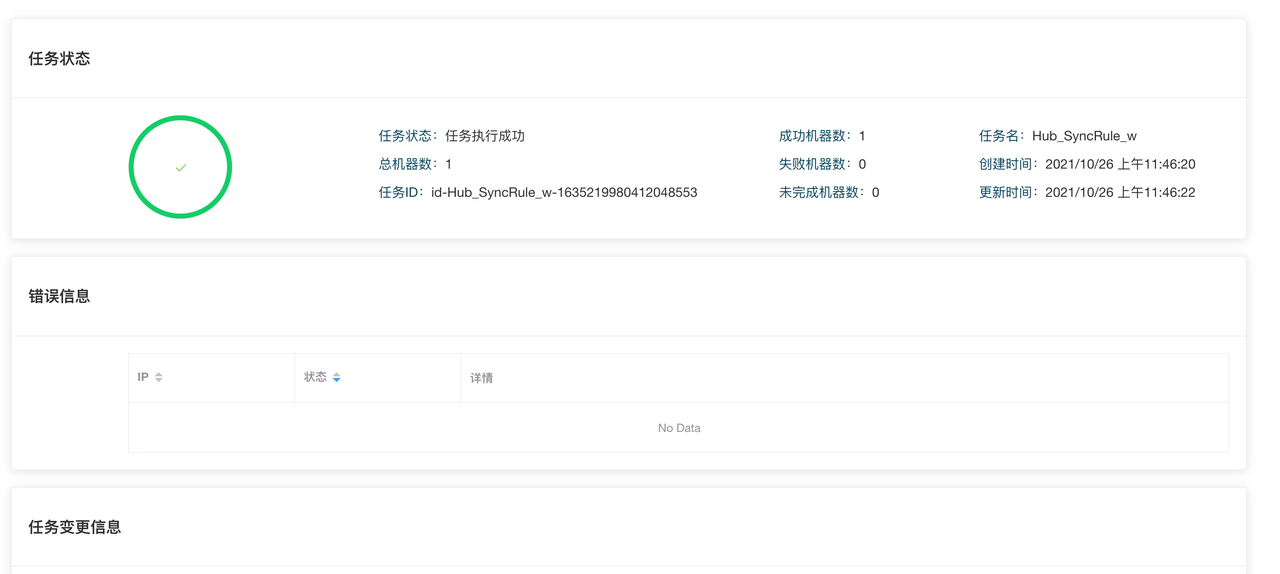
任务提交后,会自动跳转到任务详情页面,显示当前任务执行进度。
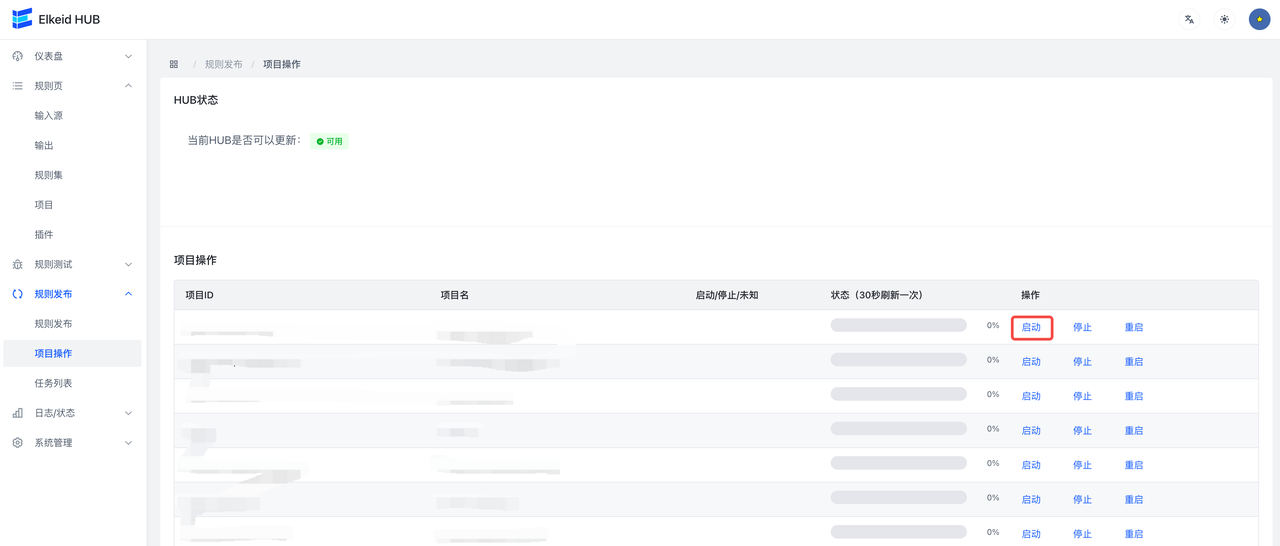
配置下发完成后,需要启动刚才新建的两个项目,进入规则发布->项目操作页面,分别启动全部已有的 项目。
进阶操作
配置ES Index查看报警
此步骤适用于OutputType使用ES的用户,Kafka用户可以自行配置。
| 建议先使用反弹shell等恶意行为触发一下告警流,让至少一条数据先打入ES,从而在Kibana上可以配置Index Pattern。 |
|---|
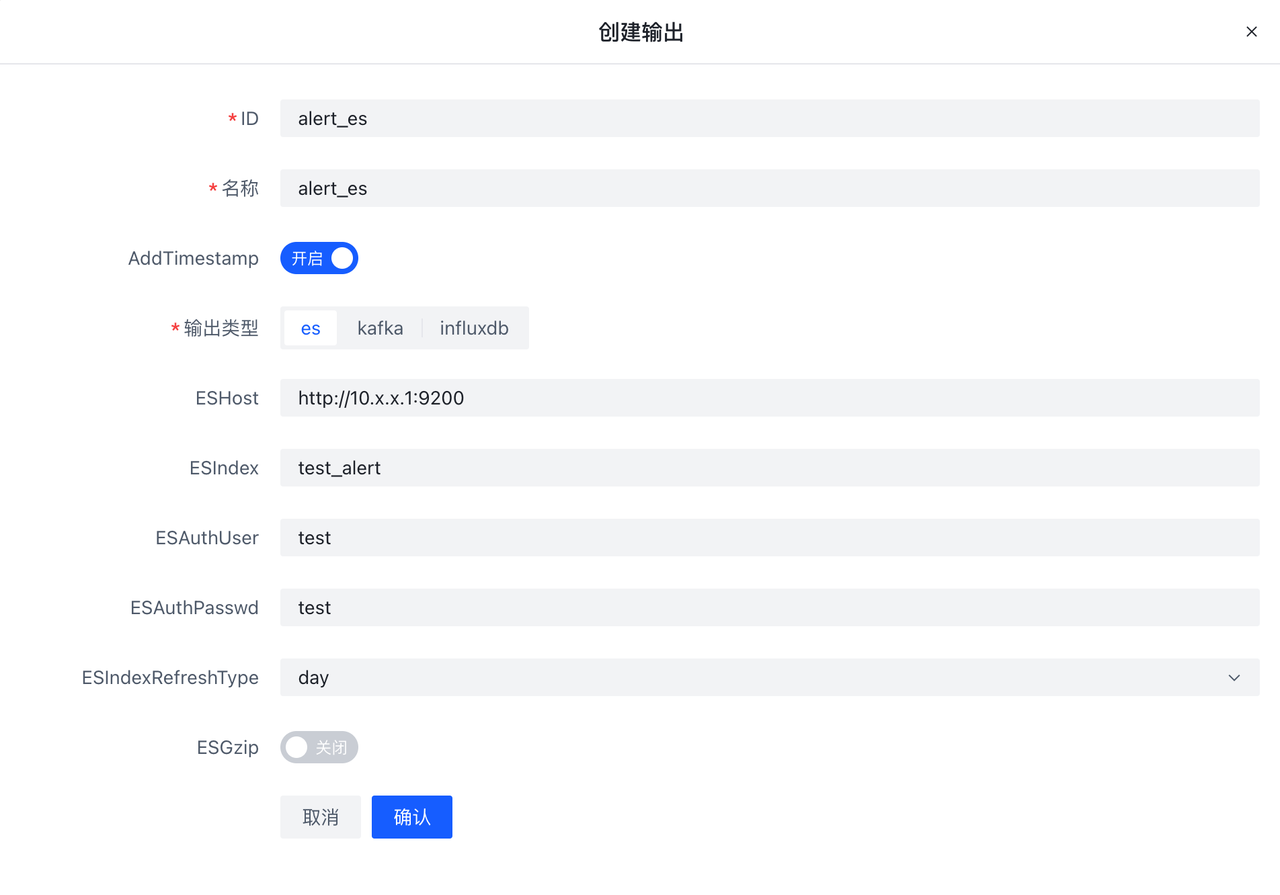
- 在输出页配置es类型的输出,可开启AddTimestamp,方便在kibana页面配置相关索引
- 编辑hids项目,加入刚编些好的es输出
- 提交变更
- 首先进入ES 的 stack management,选择kibana 的index patterns,点击 create index patten
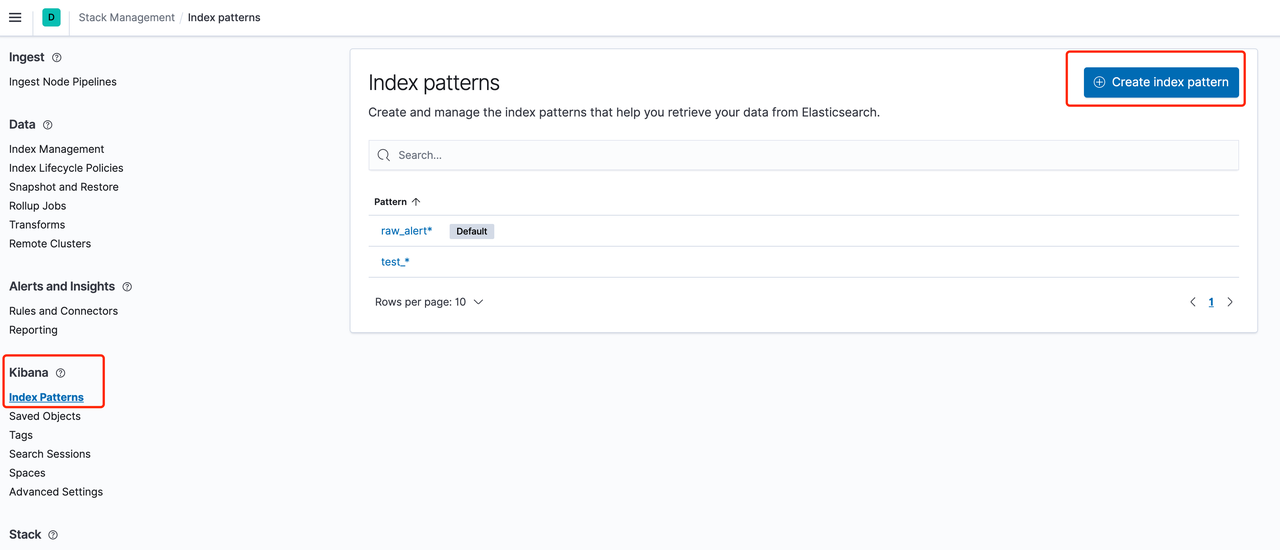
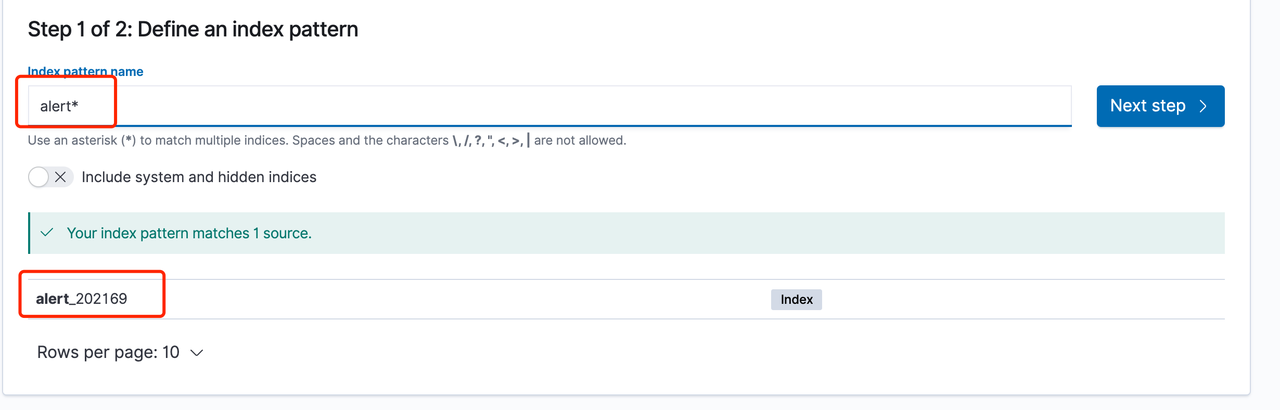
- 输入之前填入的ES output index name,以星号 * 作为后缀,这里以默认推荐优先,分别为alert 或者 raw_alert
- 如果这时index中存在数据(即已经触发过告警流),那么应能正确匹配到alert或者 raw_alert index
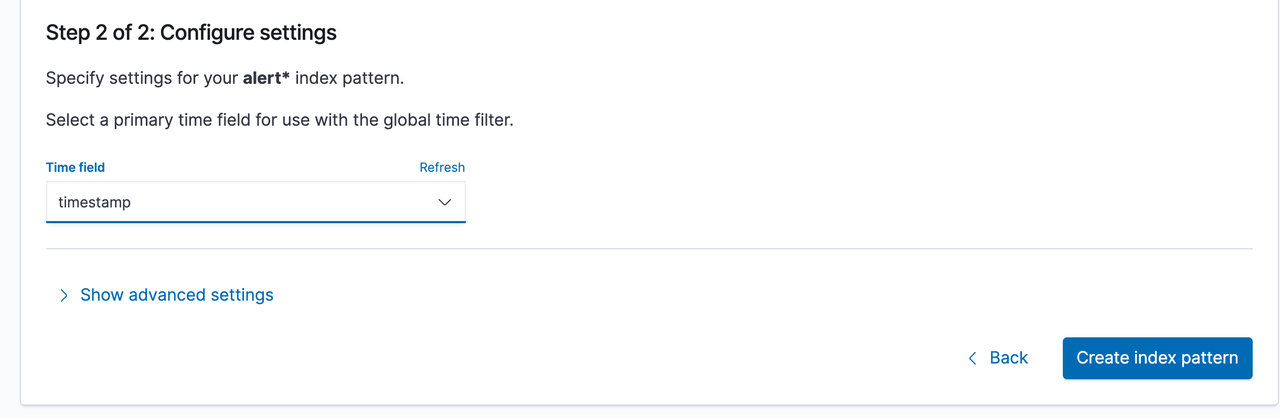
- 配置时间字段
- 如果这时index中存在数据(即已经触发过告警流),那么应能正确匹配到timestamp字段,否则此处无下拉选择框
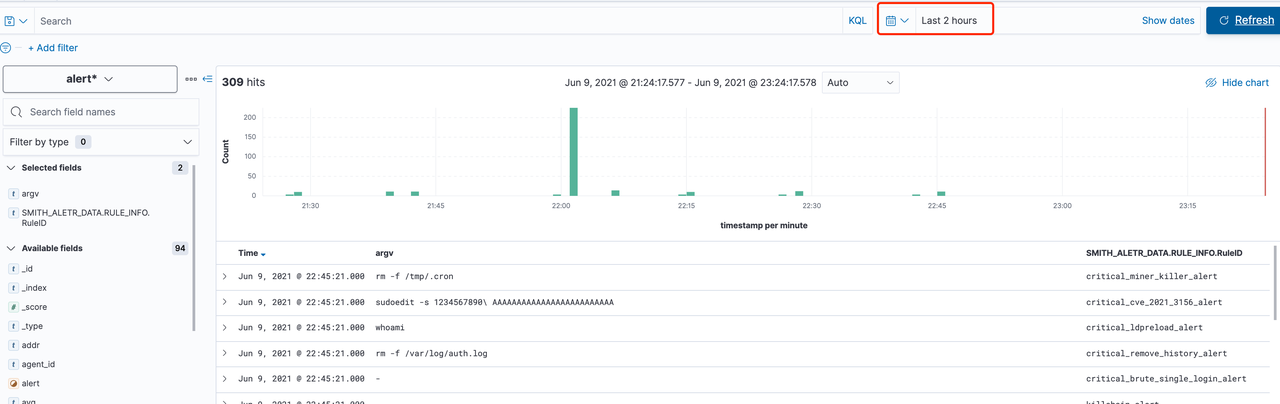
- 去浏览数据
- 进入discover 看板,选择刚才创建的 alert* 看板,调整右侧时间,即可看到告警
示例
sqlmap检测规则编写
在本教程中,会尝试在前端中编写一条规则,为检查执行sqlmap命令的规则.
在该检测场景中,我们只需要关注Execve相关的信息,因此我添加了data_type为59的过滤字段,因此该规则只会对data_type为59的数据进行处理。之后我添加了一个CheckNode,检查数据中argv字段中是否包含'sqlmap',编写完的效果如下:
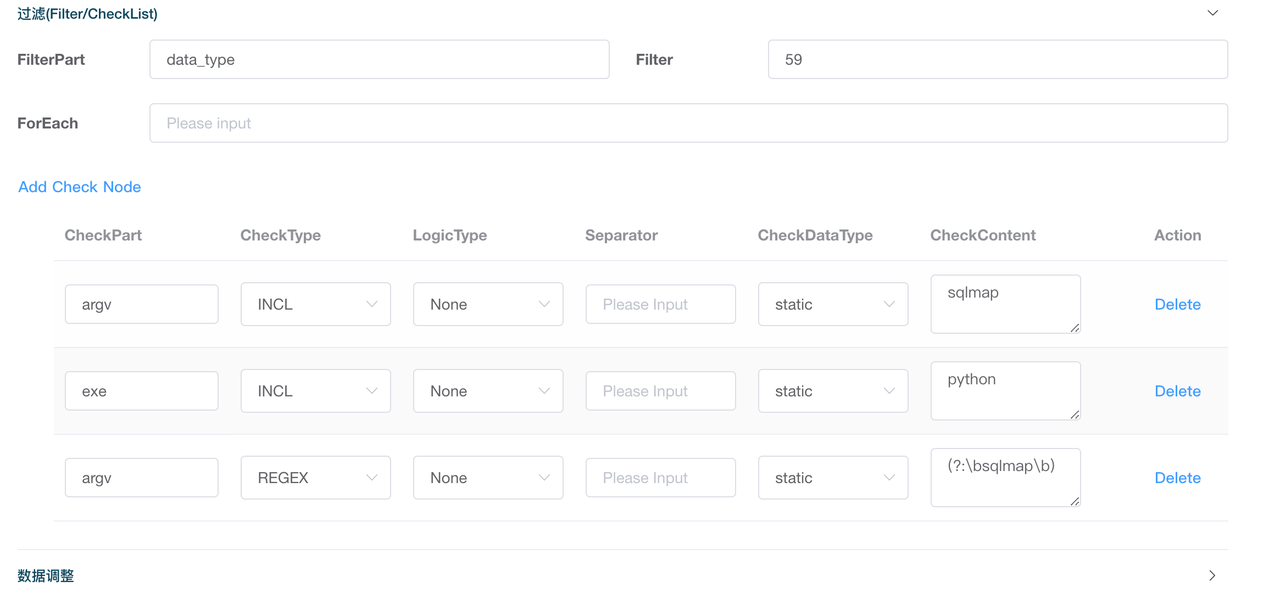
可以看到分别设置了三个CheckNode来进行检测,一是直接检测argv中是否包含sqlmap,二是检测exe字段是否包含python,三是使用正则来进行匹配是否为单独的word,当这三个同时满足,就会触发报警,编写好后,点击保存。
我们单独为该测试规则建立一个Output和Project,如下图所示:
进入测试环境执行sqlmap相关指令,在kibana中添加对应的index pattern,稍微等待一会就可以找到对应的报警结果。
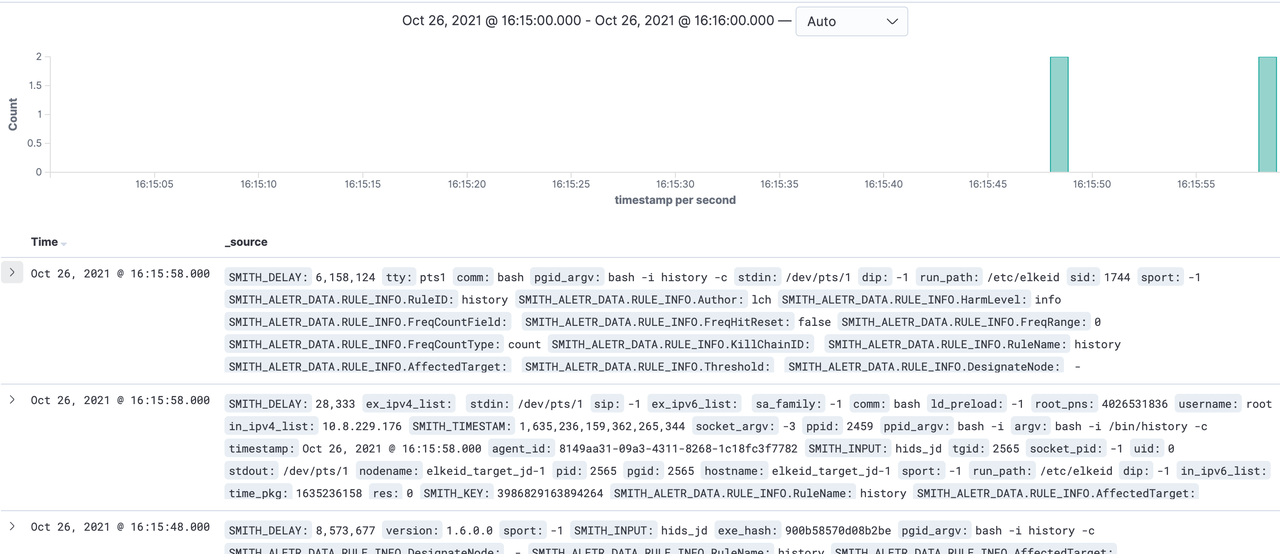
可以看到出现了报警。
推送飞书插件编写
规则写完了,如果我想在发生该事件的时候飞书提醒我该如何实现呢?RuleSet并不支持这项功能,此时可以通过编写插件来实现。
创建并使用Python 插件的步骤如下:
- 点击创建按钮
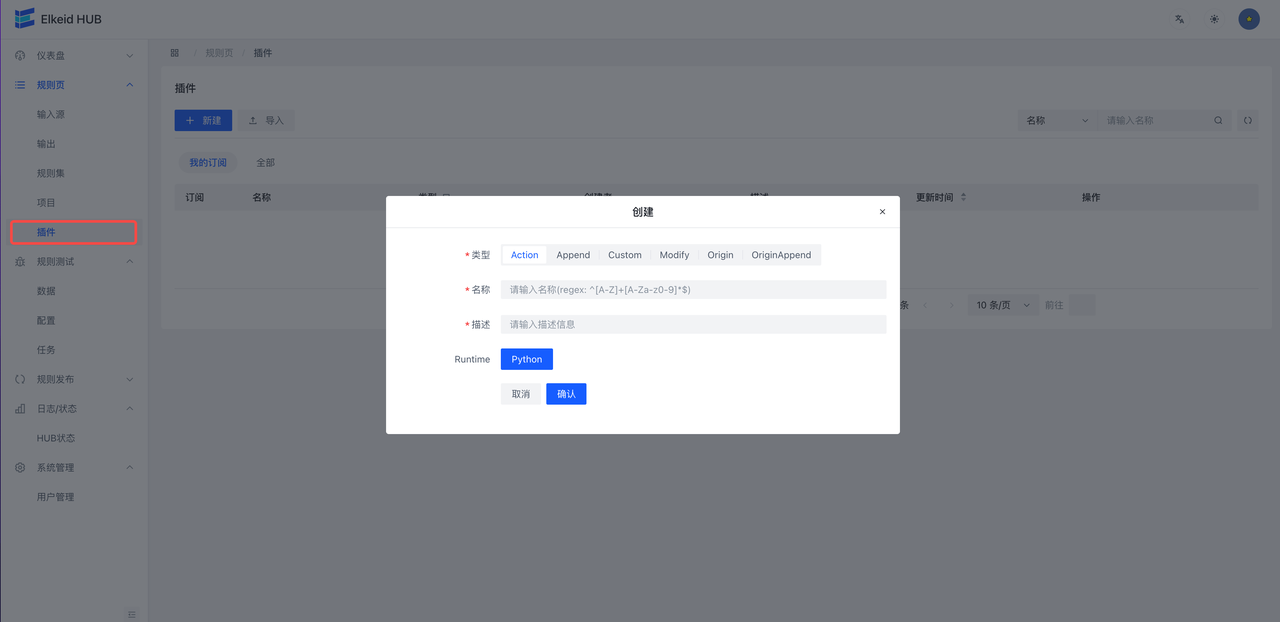
- 按照需求,填写信息
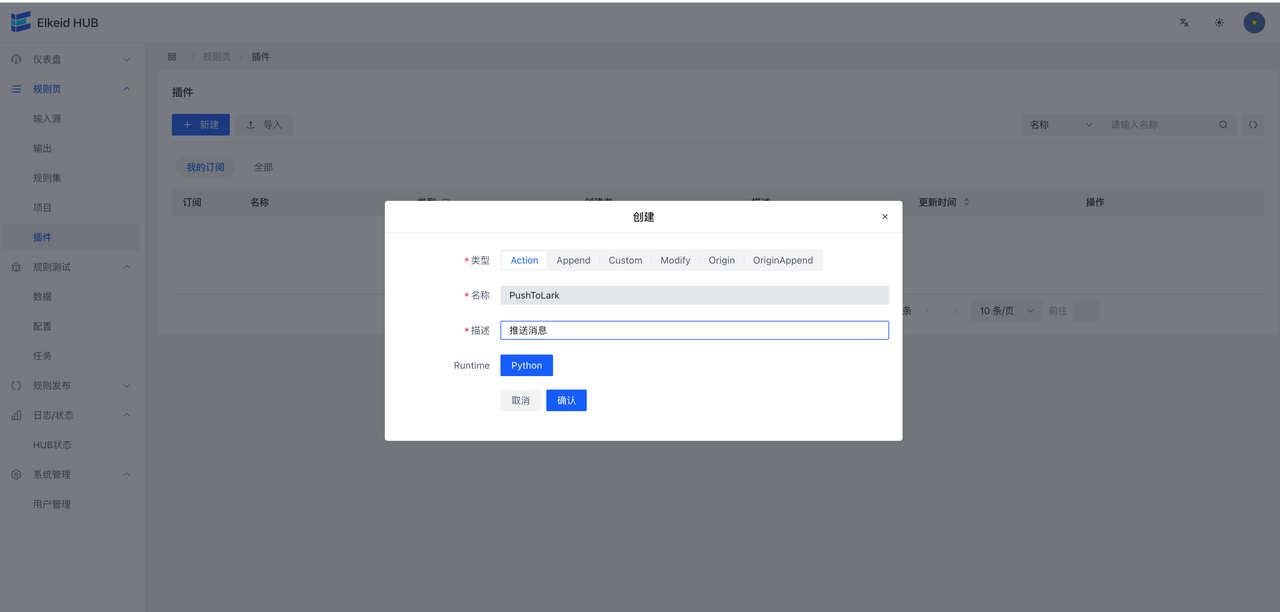
- 点击确认,完成创建
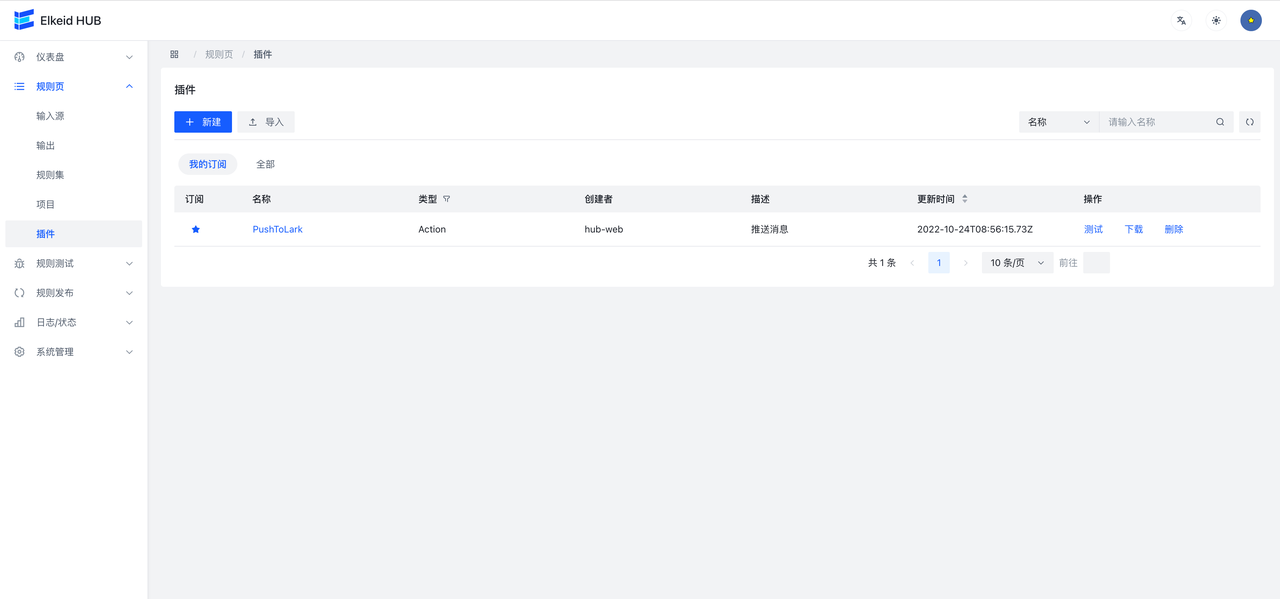
- 编辑插件
默认为只读状态,需要点击编辑才能进行编辑
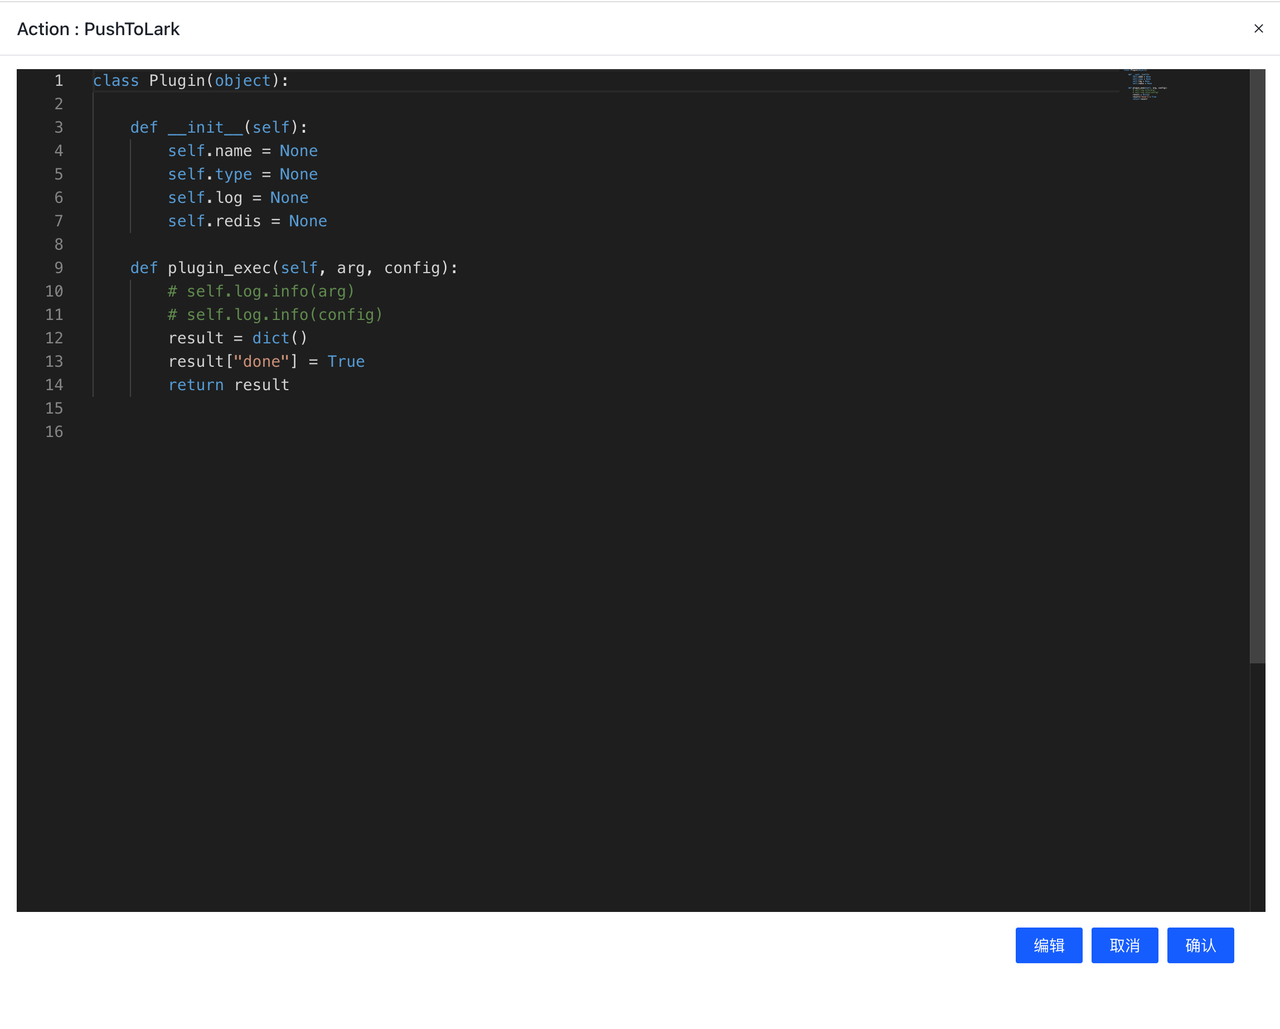
编辑后点击保存
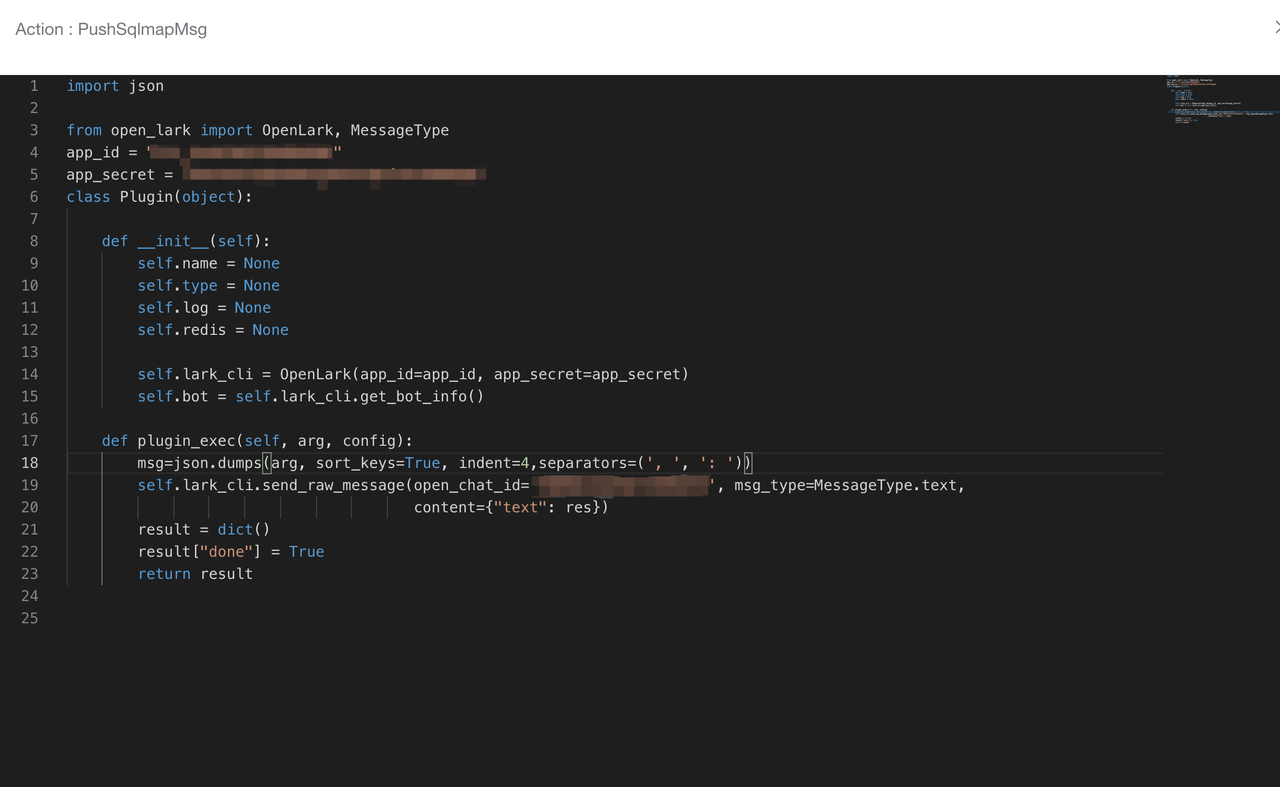
- 在Rule中添加action

- 同策略发布相同,在策略发布界面发布策略
这样每当这个rule的条件被触发,就会调用这个插件进行报警。
Elkeid CWPP Application Runtime Protection (RASP) User Guide
This guide covers the following features:
- Operation and maintenance of application runtime components through CWPP.
- Control the RASP implant probe into the target process to complete the runtime behavior acquisition.
- Implant configuration
- Blocking/Filtering, Configuration
- View CWPP's alert events.
Install/Update RASP Components
- Make sure the rasp component is included in the component list.
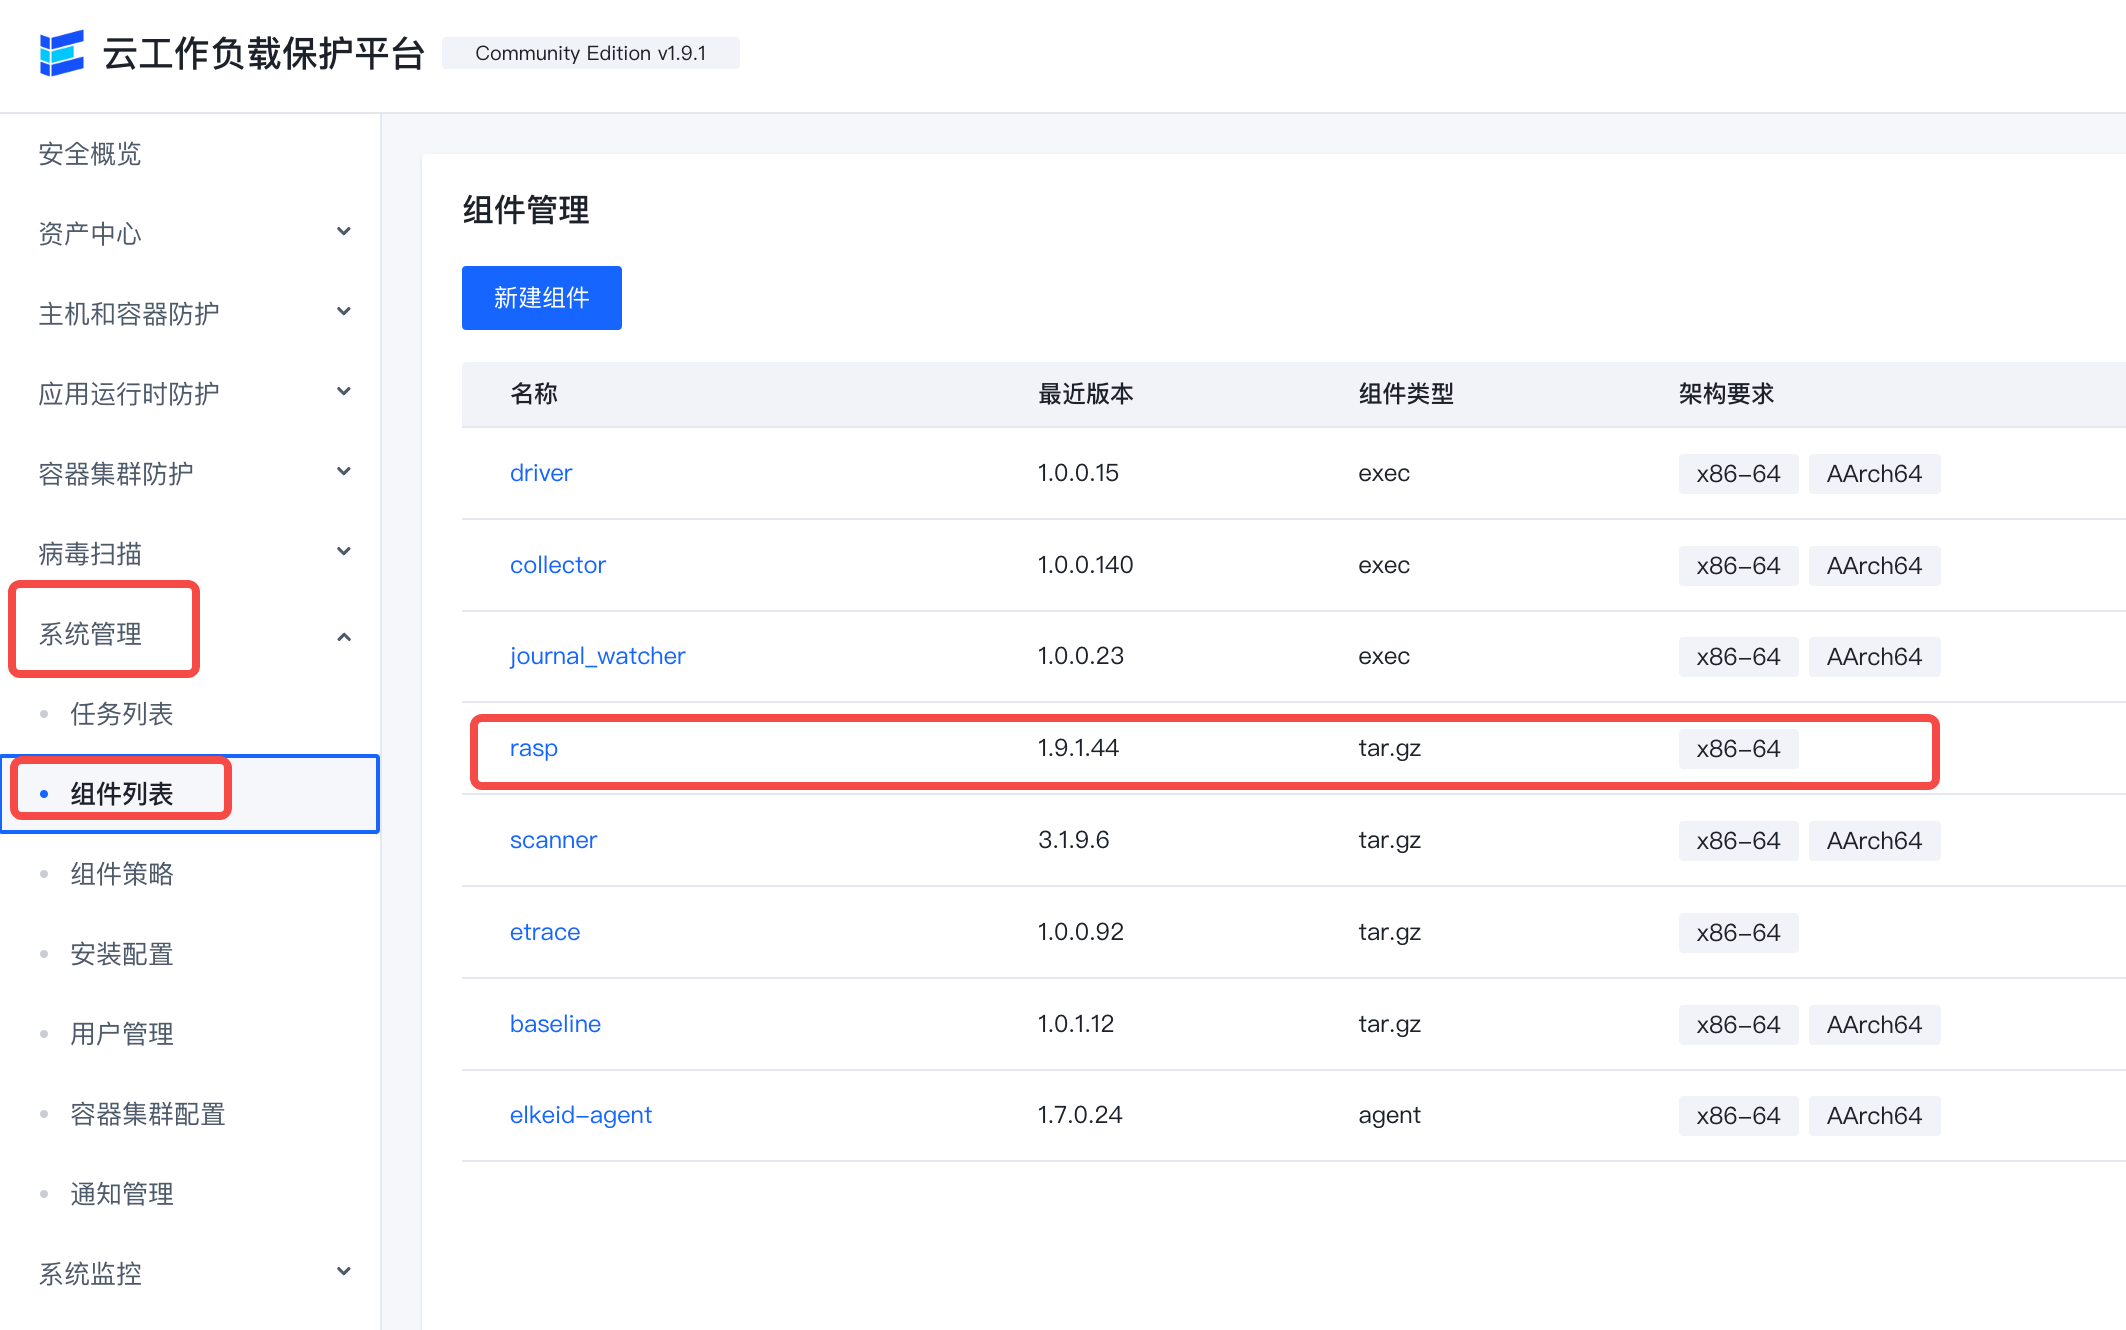
If there is no rasp component, you need to create a new component named rasp.
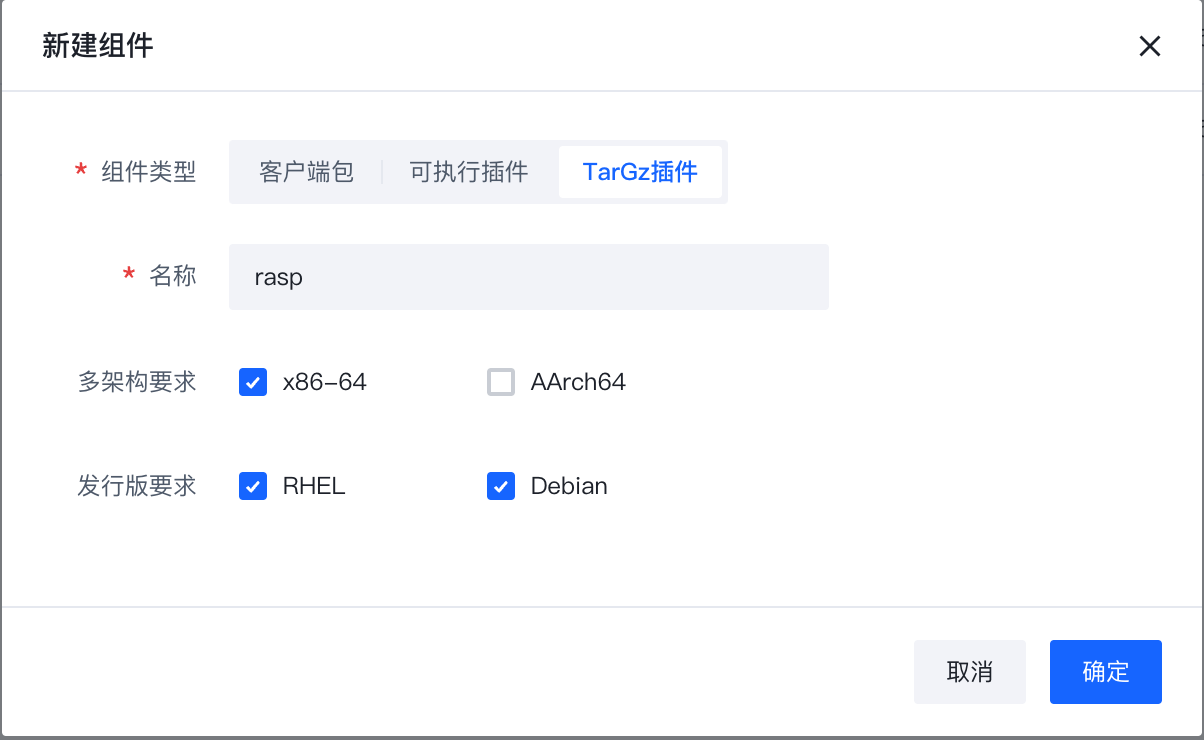
Note! Due to the Agent mechanism, the plugin name should be the same as the plugin binary name.
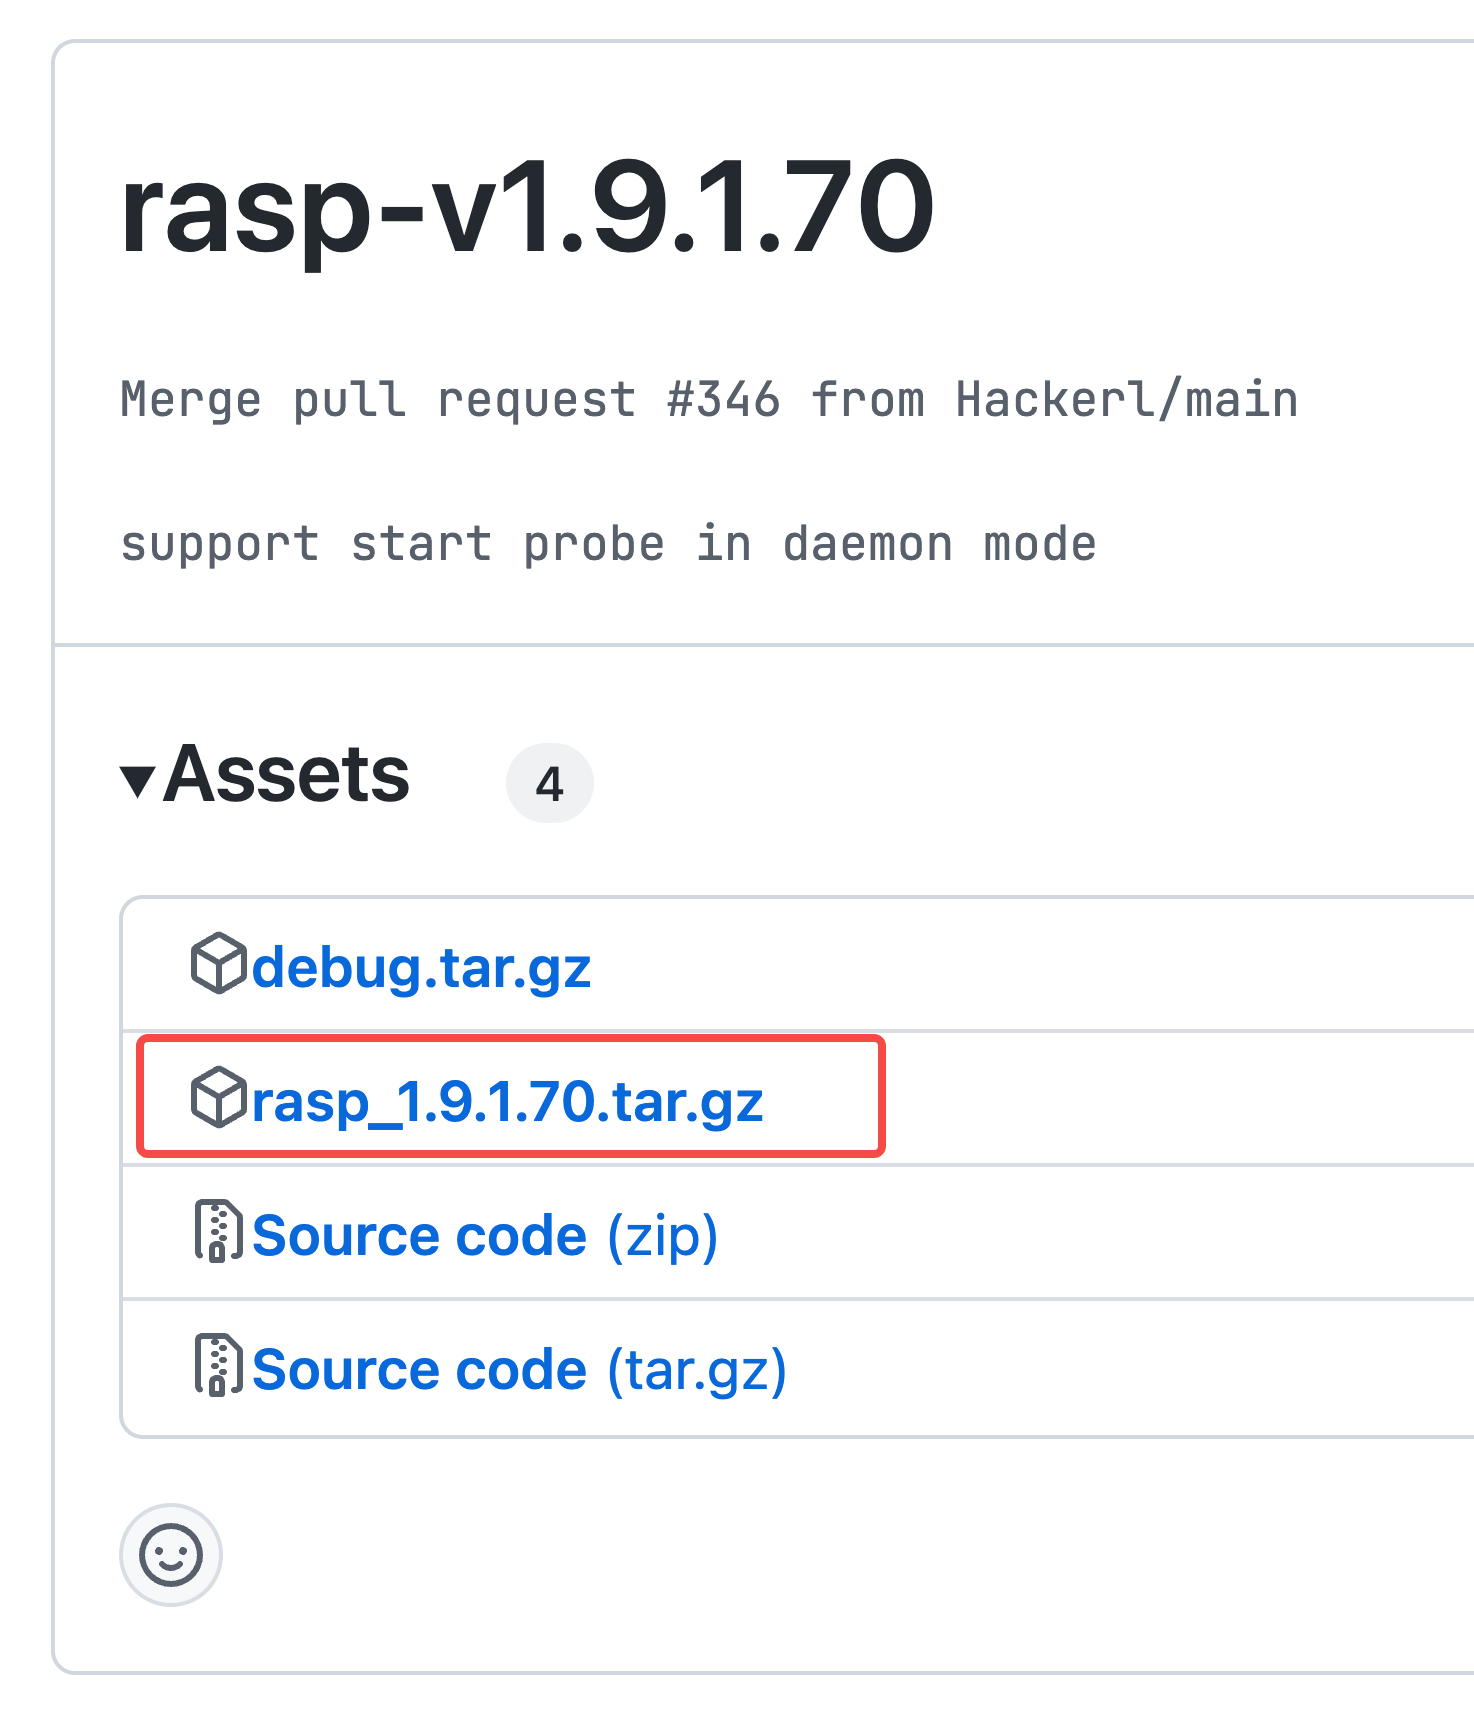
Publish the version and upload the compressed package in tar.gz format.
Please use the plugin version 1.9.1.*.
Archive address: bytedance/Elkeid: releases
-
Make sure the RASP component is included in the component policy
-
Synchronize the policy to the machine.
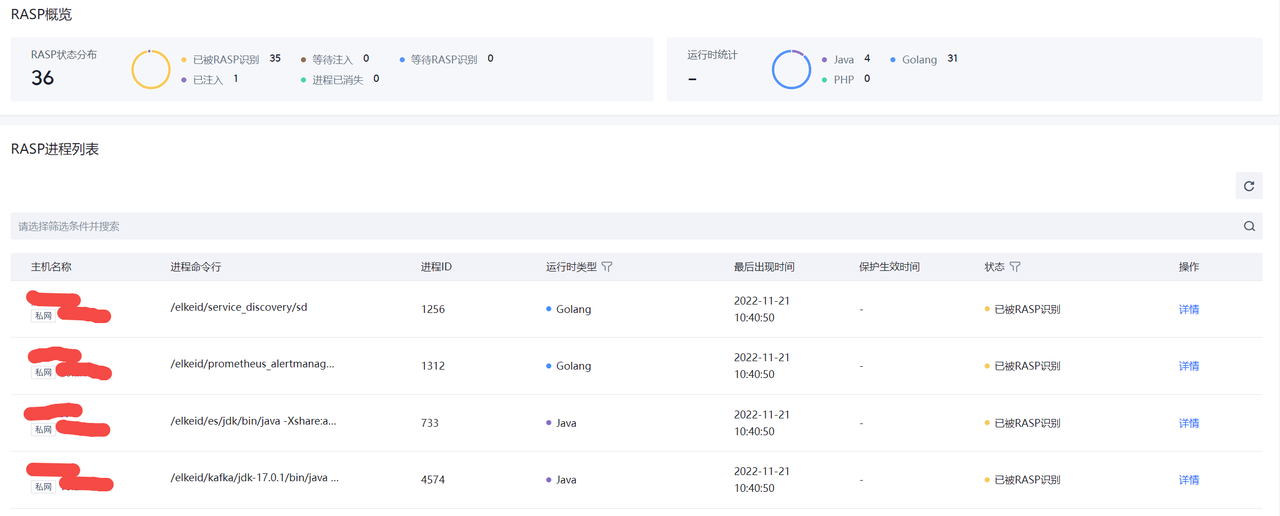
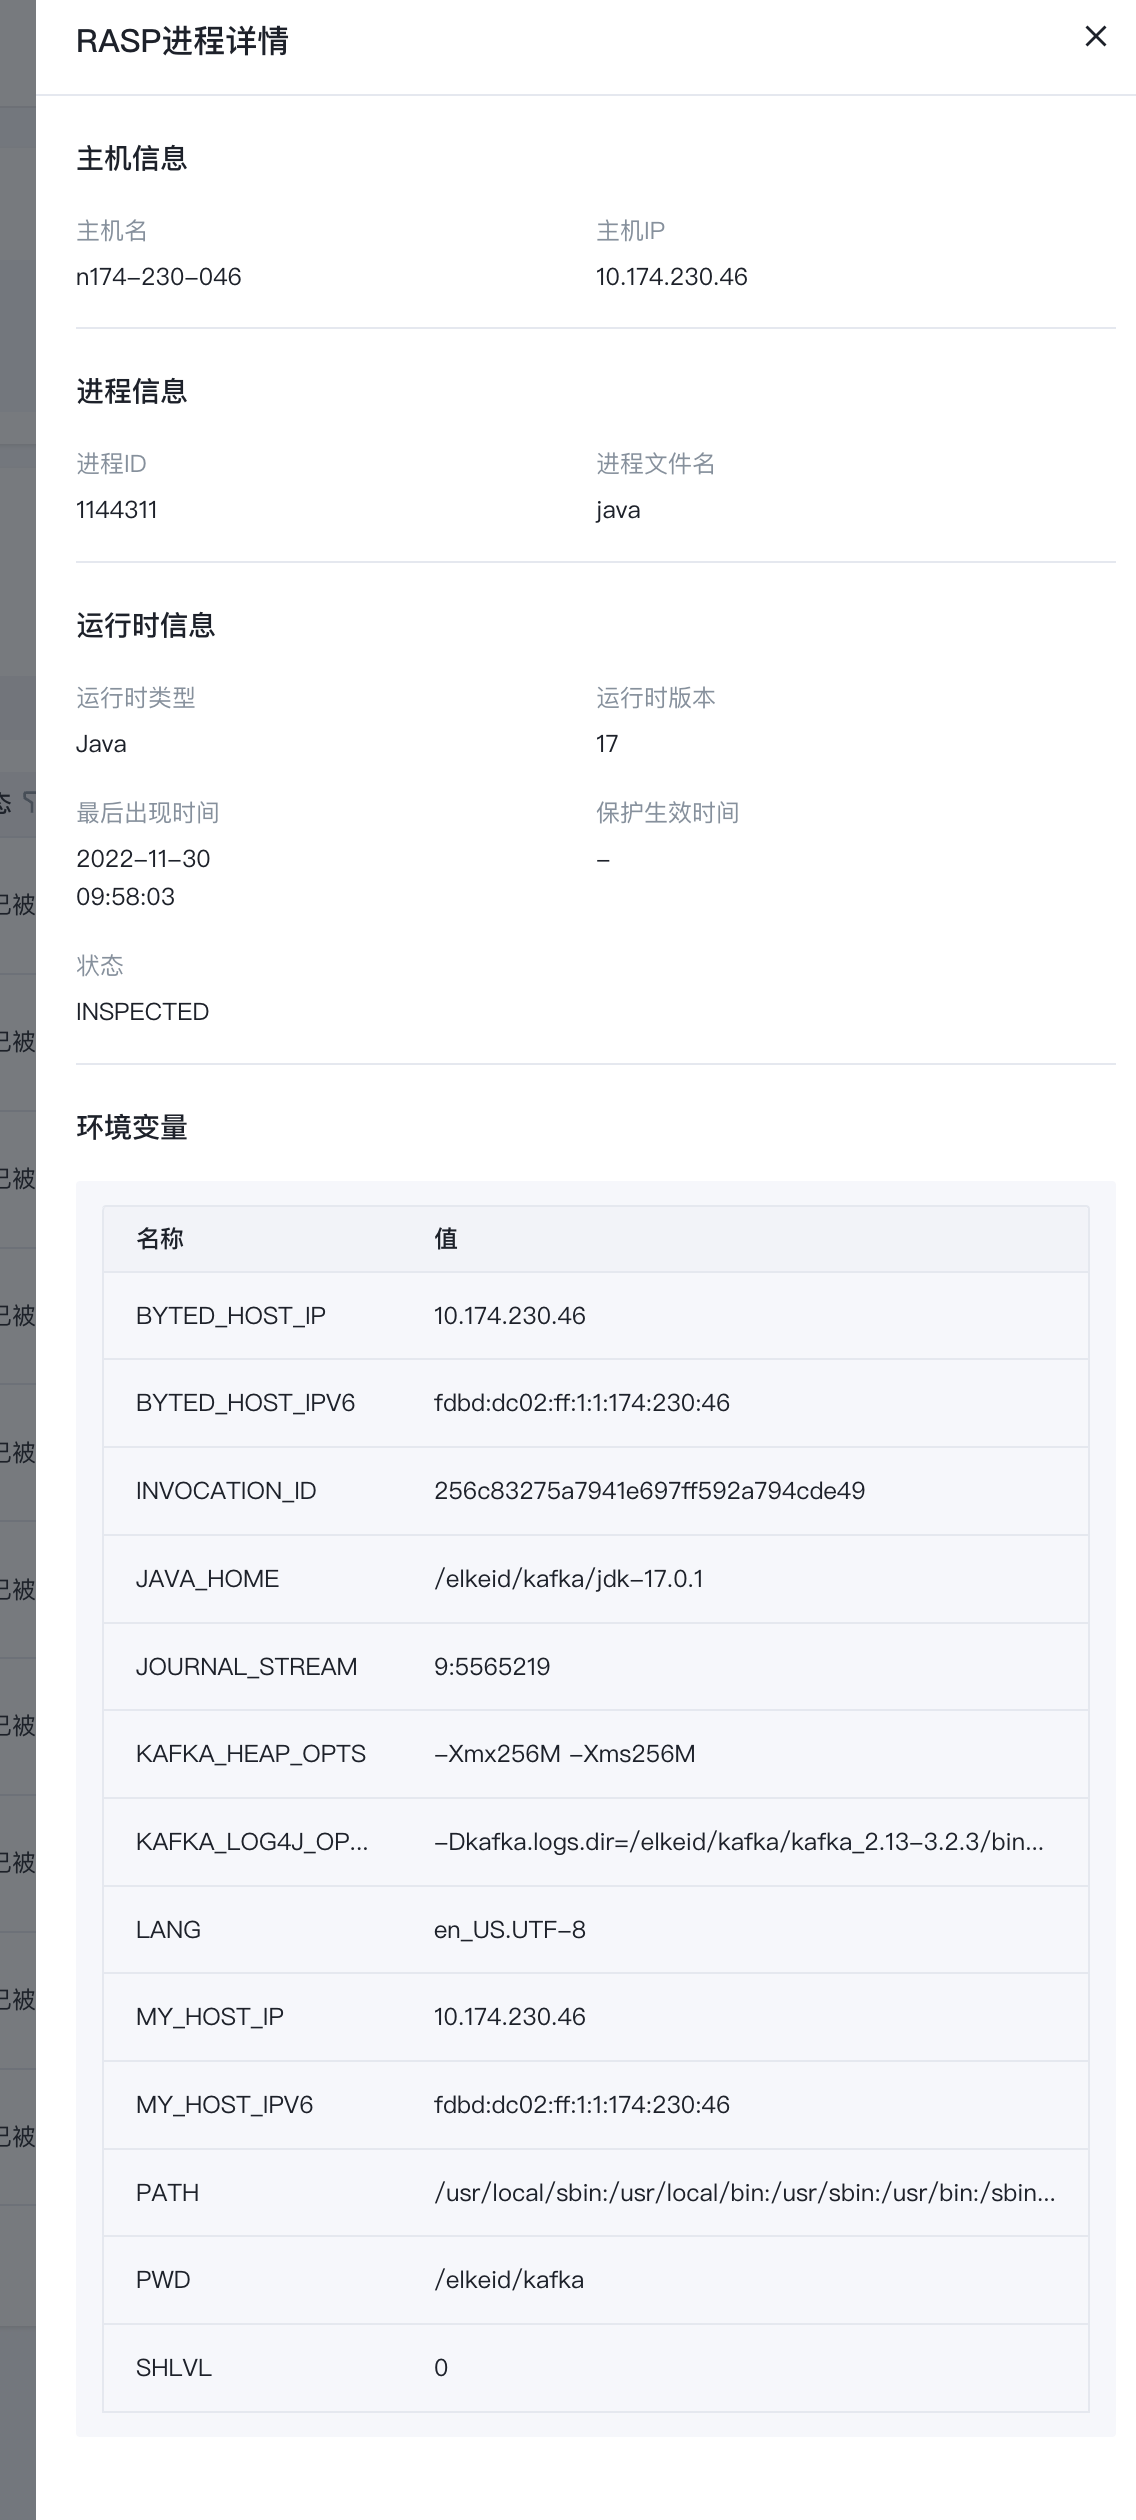
running state
After deploying the RASP component, RASP will automatically analyze the machine process, and the process information that meets the conditions for implantation of the probe will be reported to the running status.
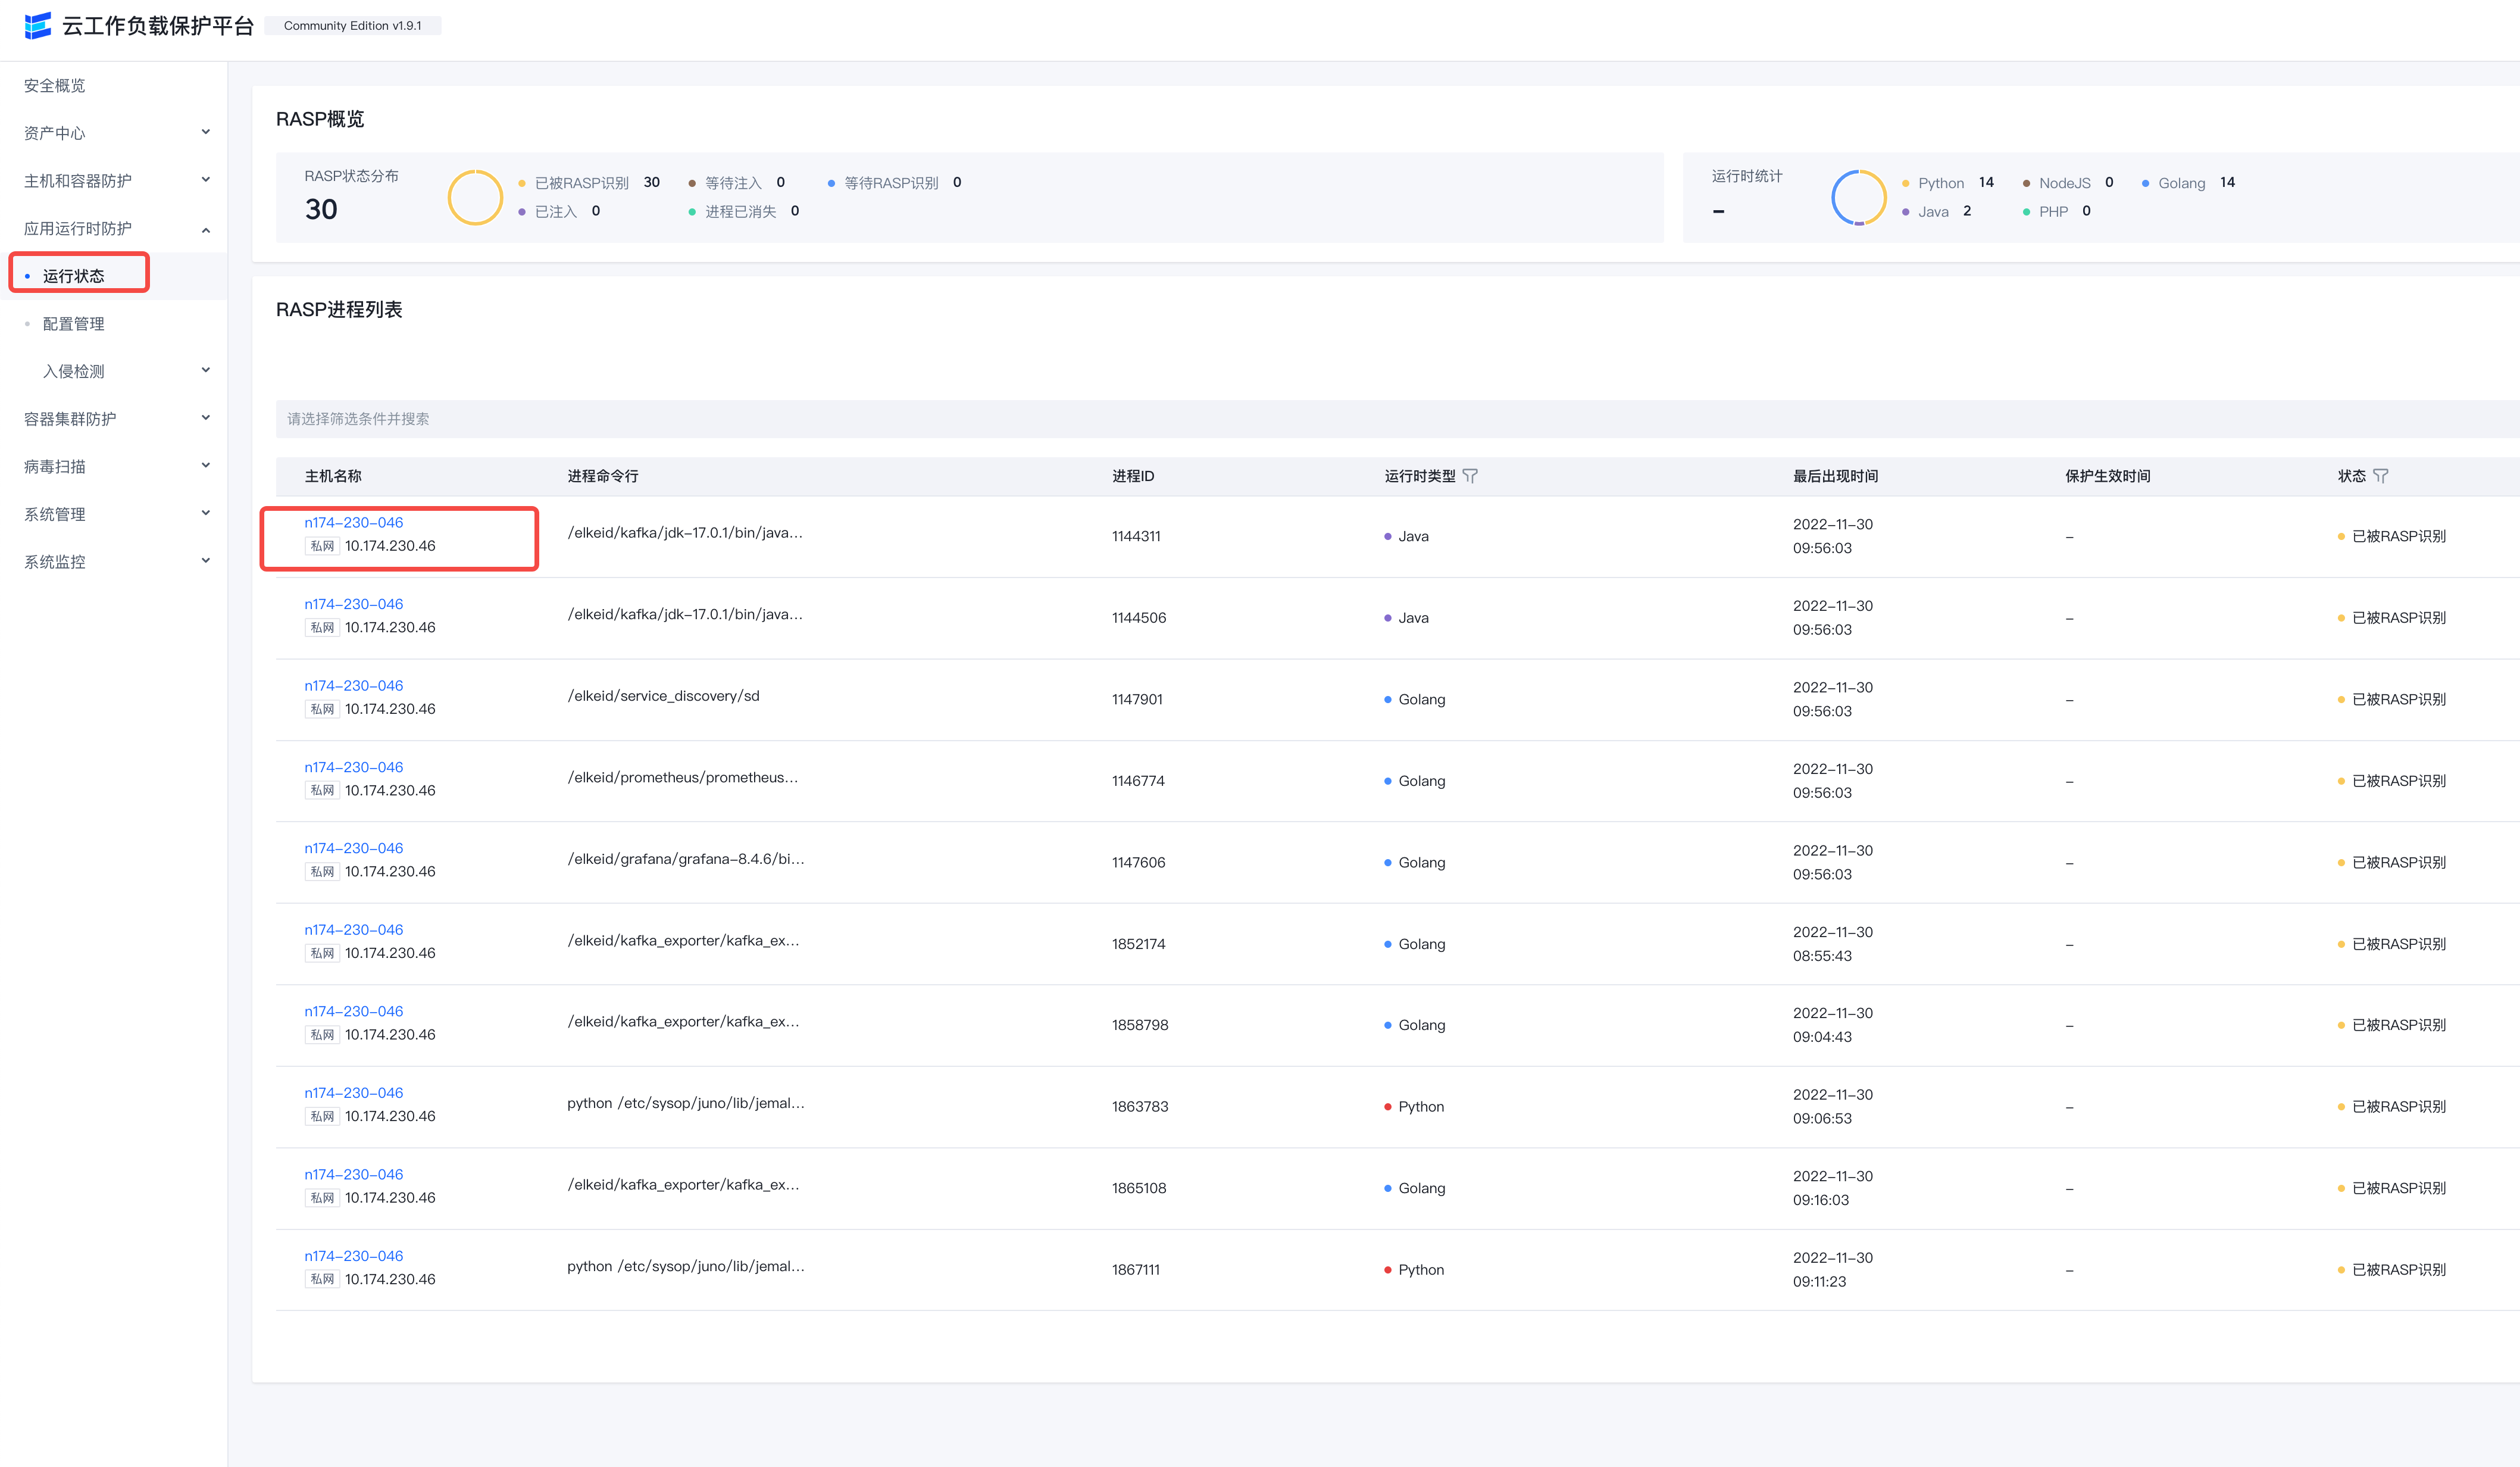 Details link on the right Support viewing process Additional information
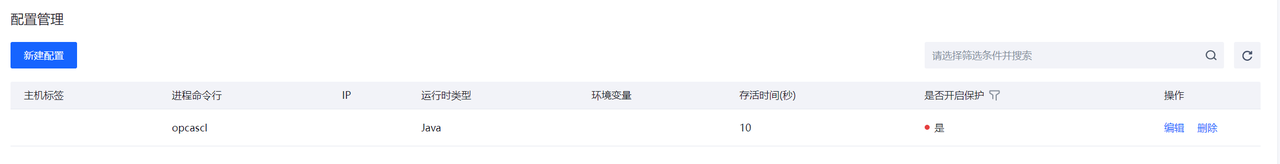
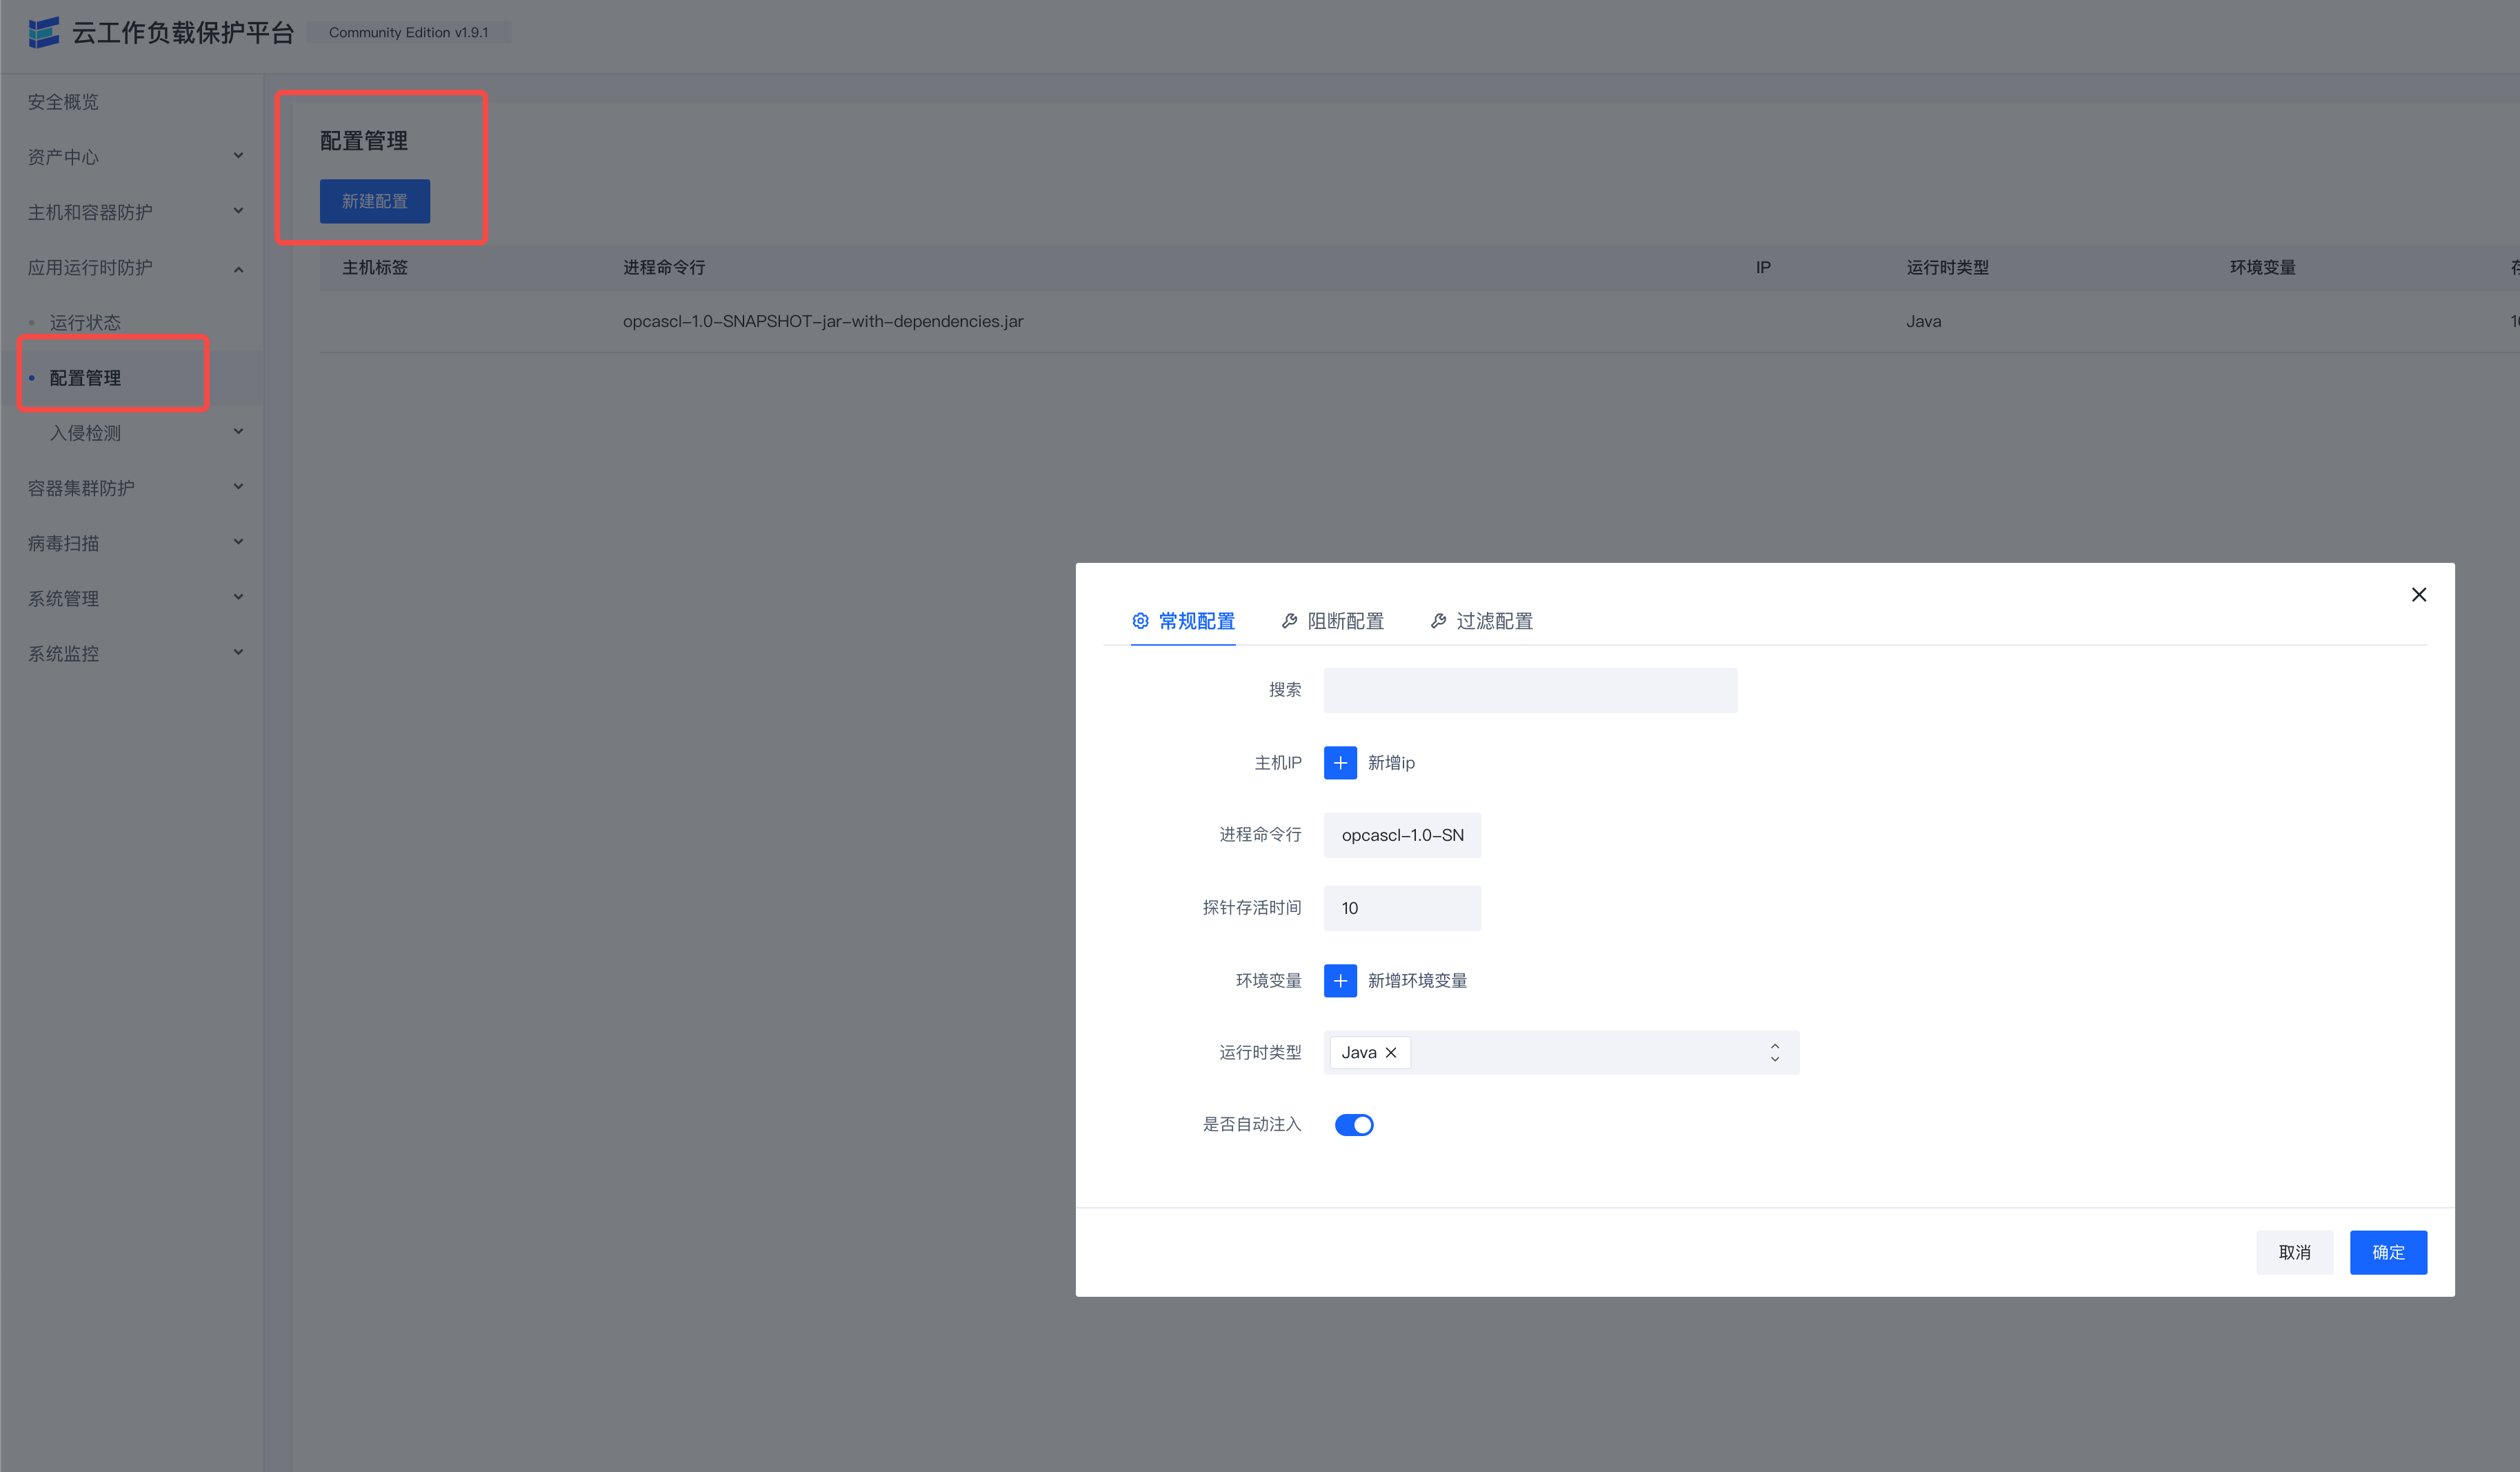
Configure
Configure which processes will turn on RASP protection
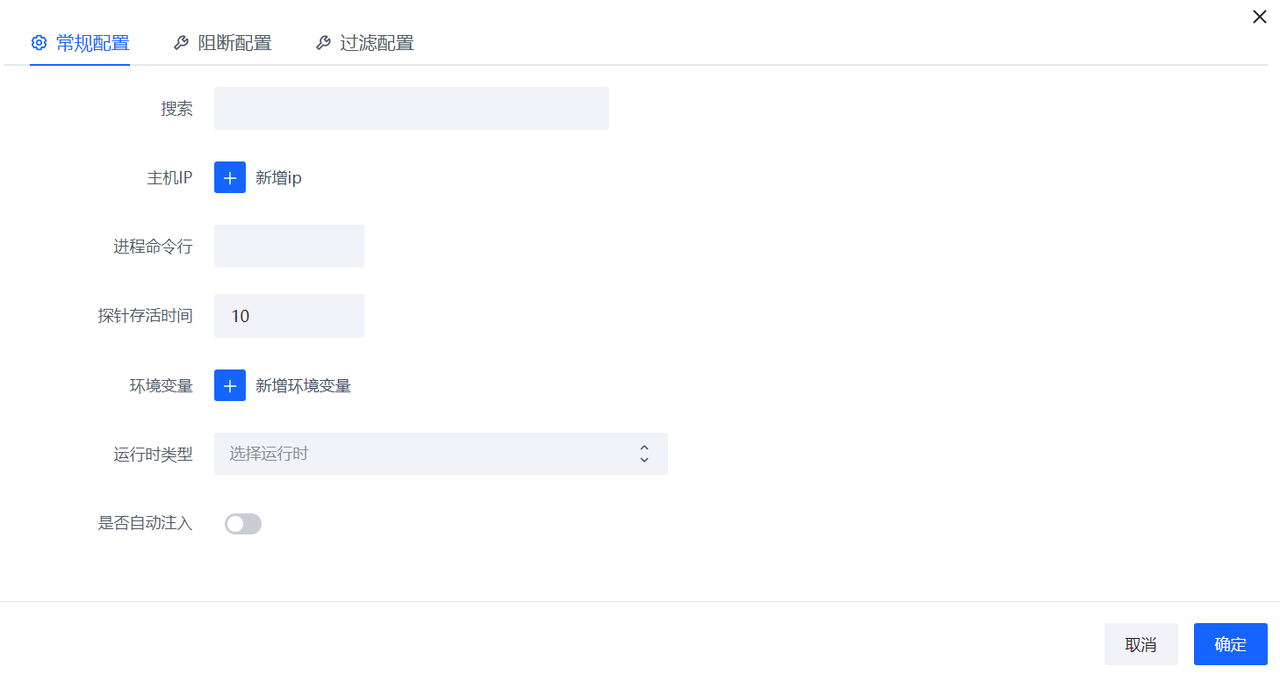
Click New Configuration
 The relationship between each form item of each configuration is AND
The relationship between each configuration is or
The relationship between each form item of each configuration is AND
The relationship between each configuration is or
| Form Items | Required or Not | Meaning Explanation | Remarks |
|---|---|---|---|
| Host Labels | No | Delineate the scope of applicable host labels for this configuration | Host labels are consistent with labels in Asset Management |
| IP | No | Match Machine IP | |
| Process command line | No | Regular matching of process command line | |
| environment variables | No | Match the environment variables of the process | Multiple environment variables can be the relationship between multiple environment variables |
| Runtime type | Yes | Which runtime is this configuration suitable for | Multiple selectable |
| Whether to enable injection | Yes | Whether to enable RASP protection for the process of configuring filtering in this article | Default is No |
Each configuration can also be configured with blocking and filtering
- Blocking: regular expression matching of a parameter of a Hook function
- When the regular expression matches, the function throws an exception to block the function from running.
- The function runs normally when the regular expression does not match.
- Filtering: regular expression matching of parameters of a Hook function
- Contains: only report matched parameter data
- does not contain: only report parameter data other than matching to
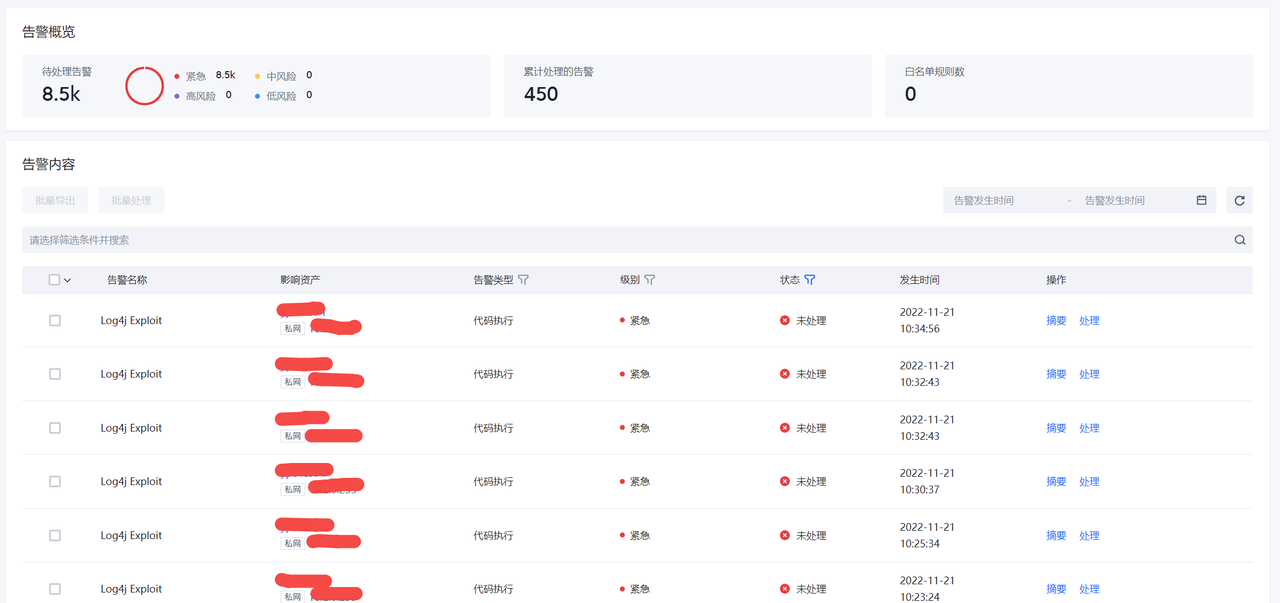
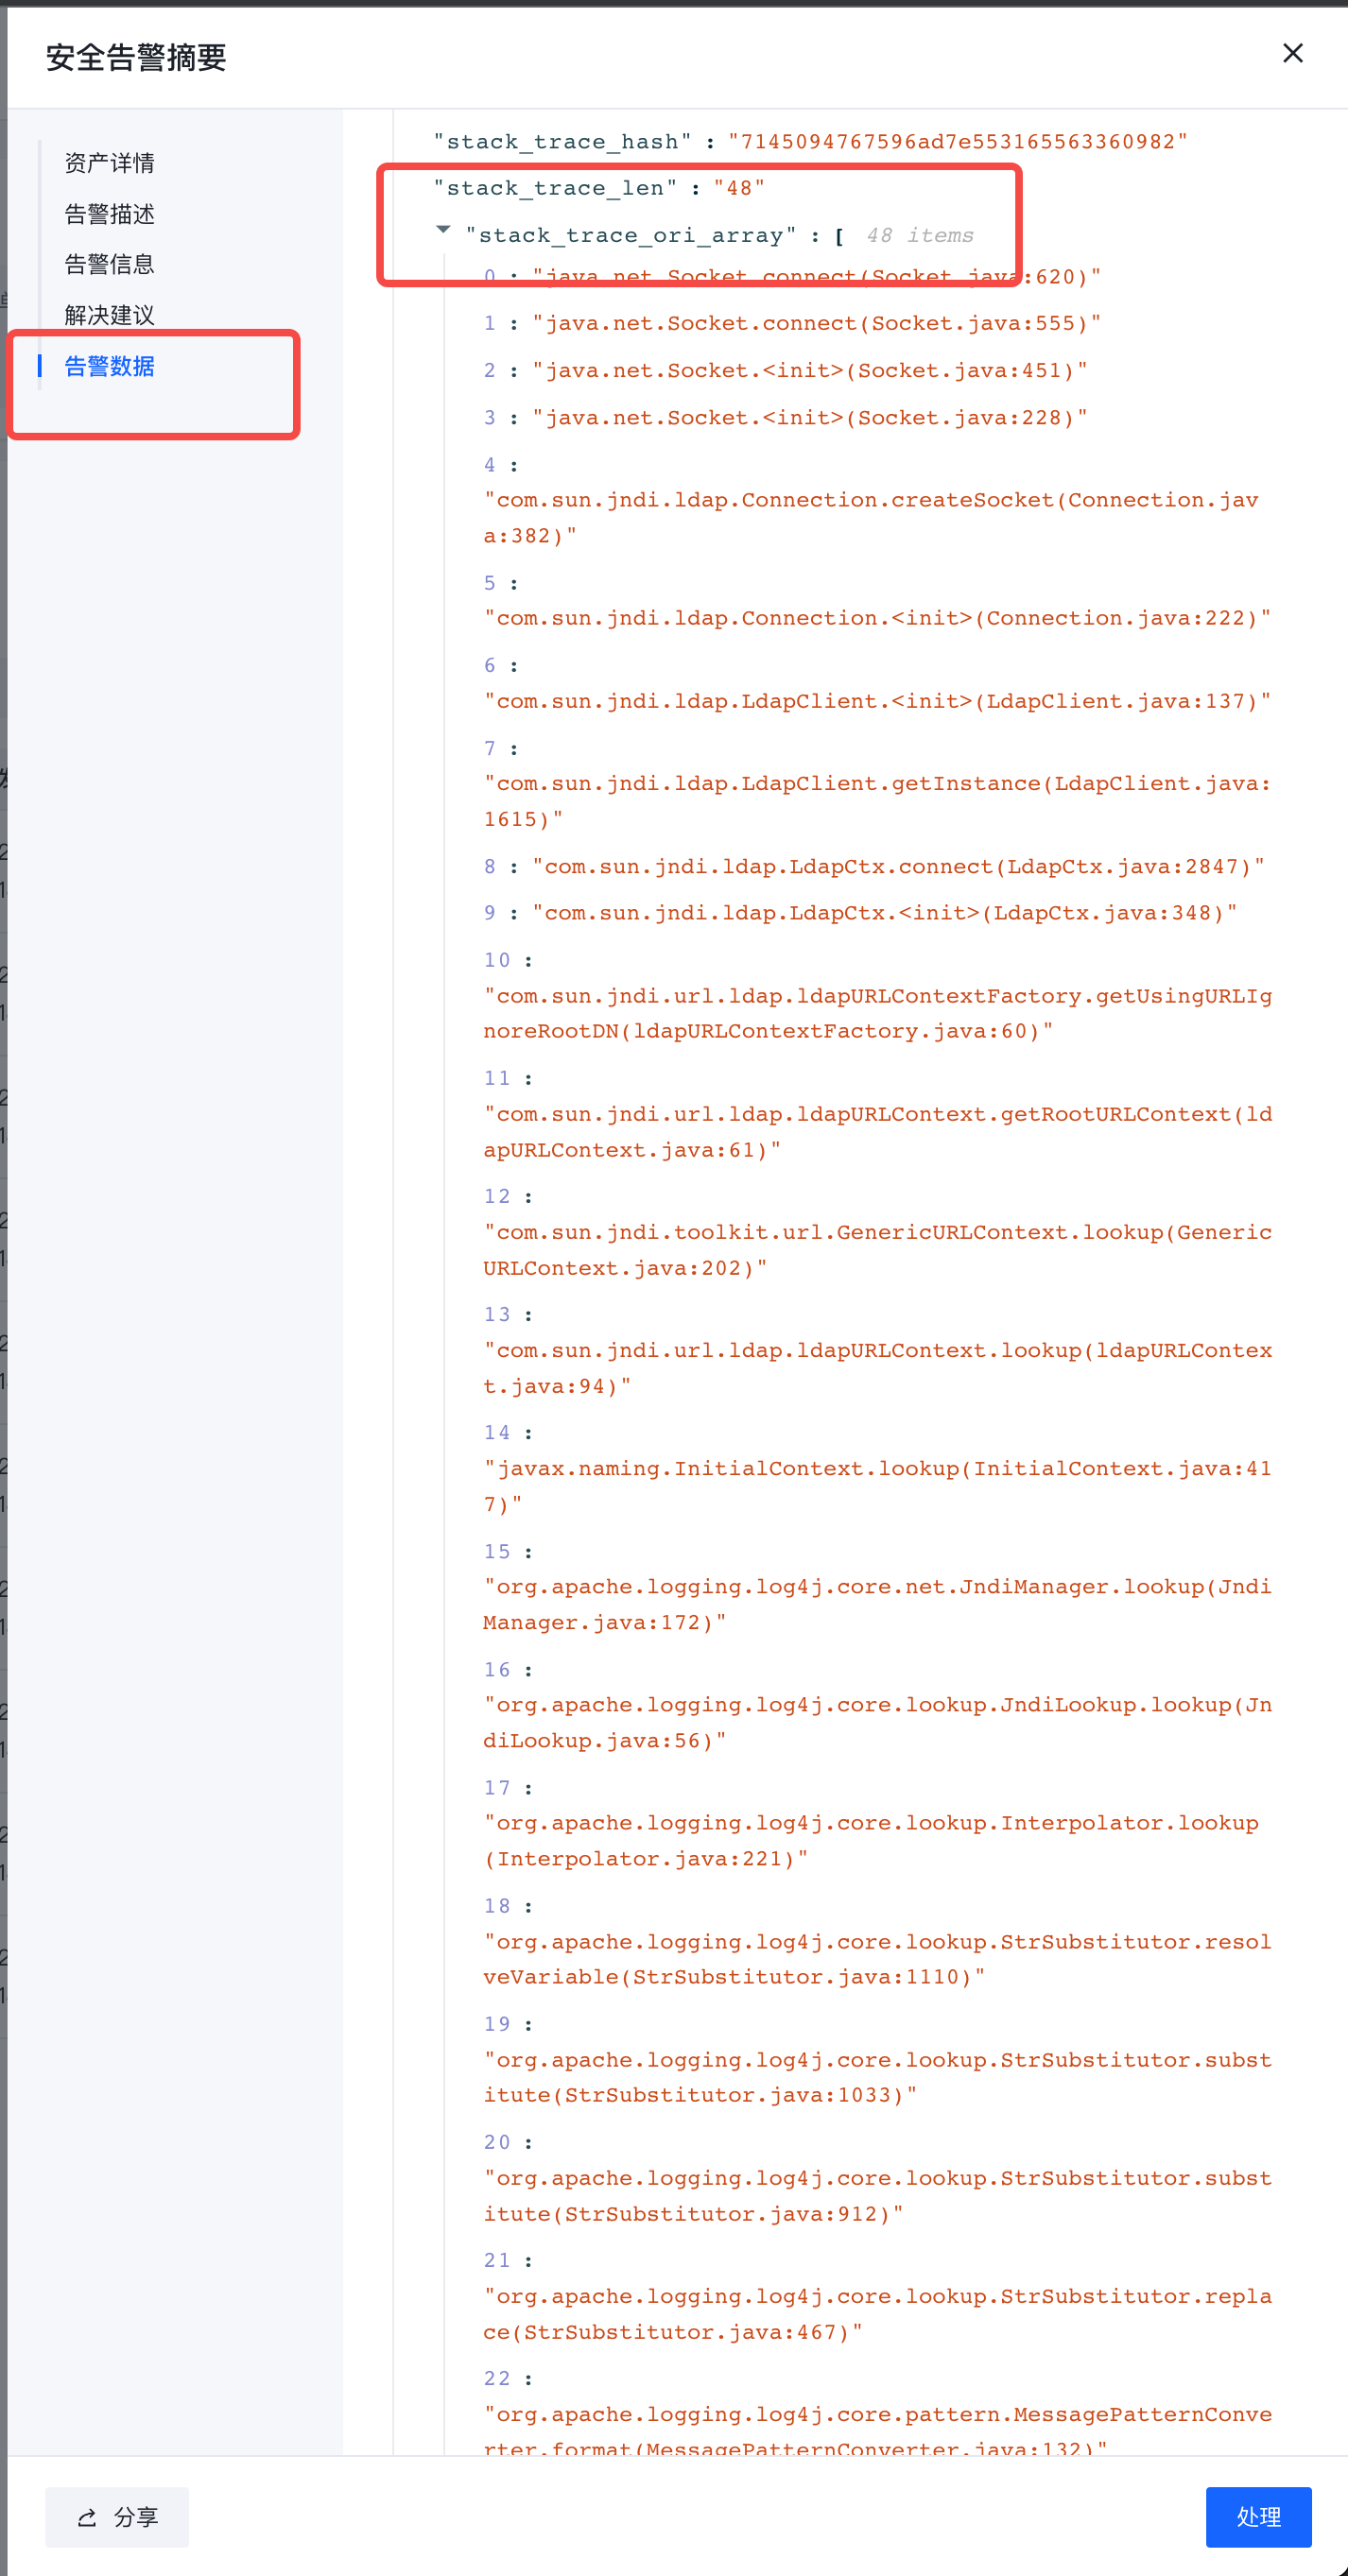
Intrusion detection
After the RASP probe is implanted in the target process, it will continue to report application behavior, and events and alarms will be generated when abnormal behavior is found.
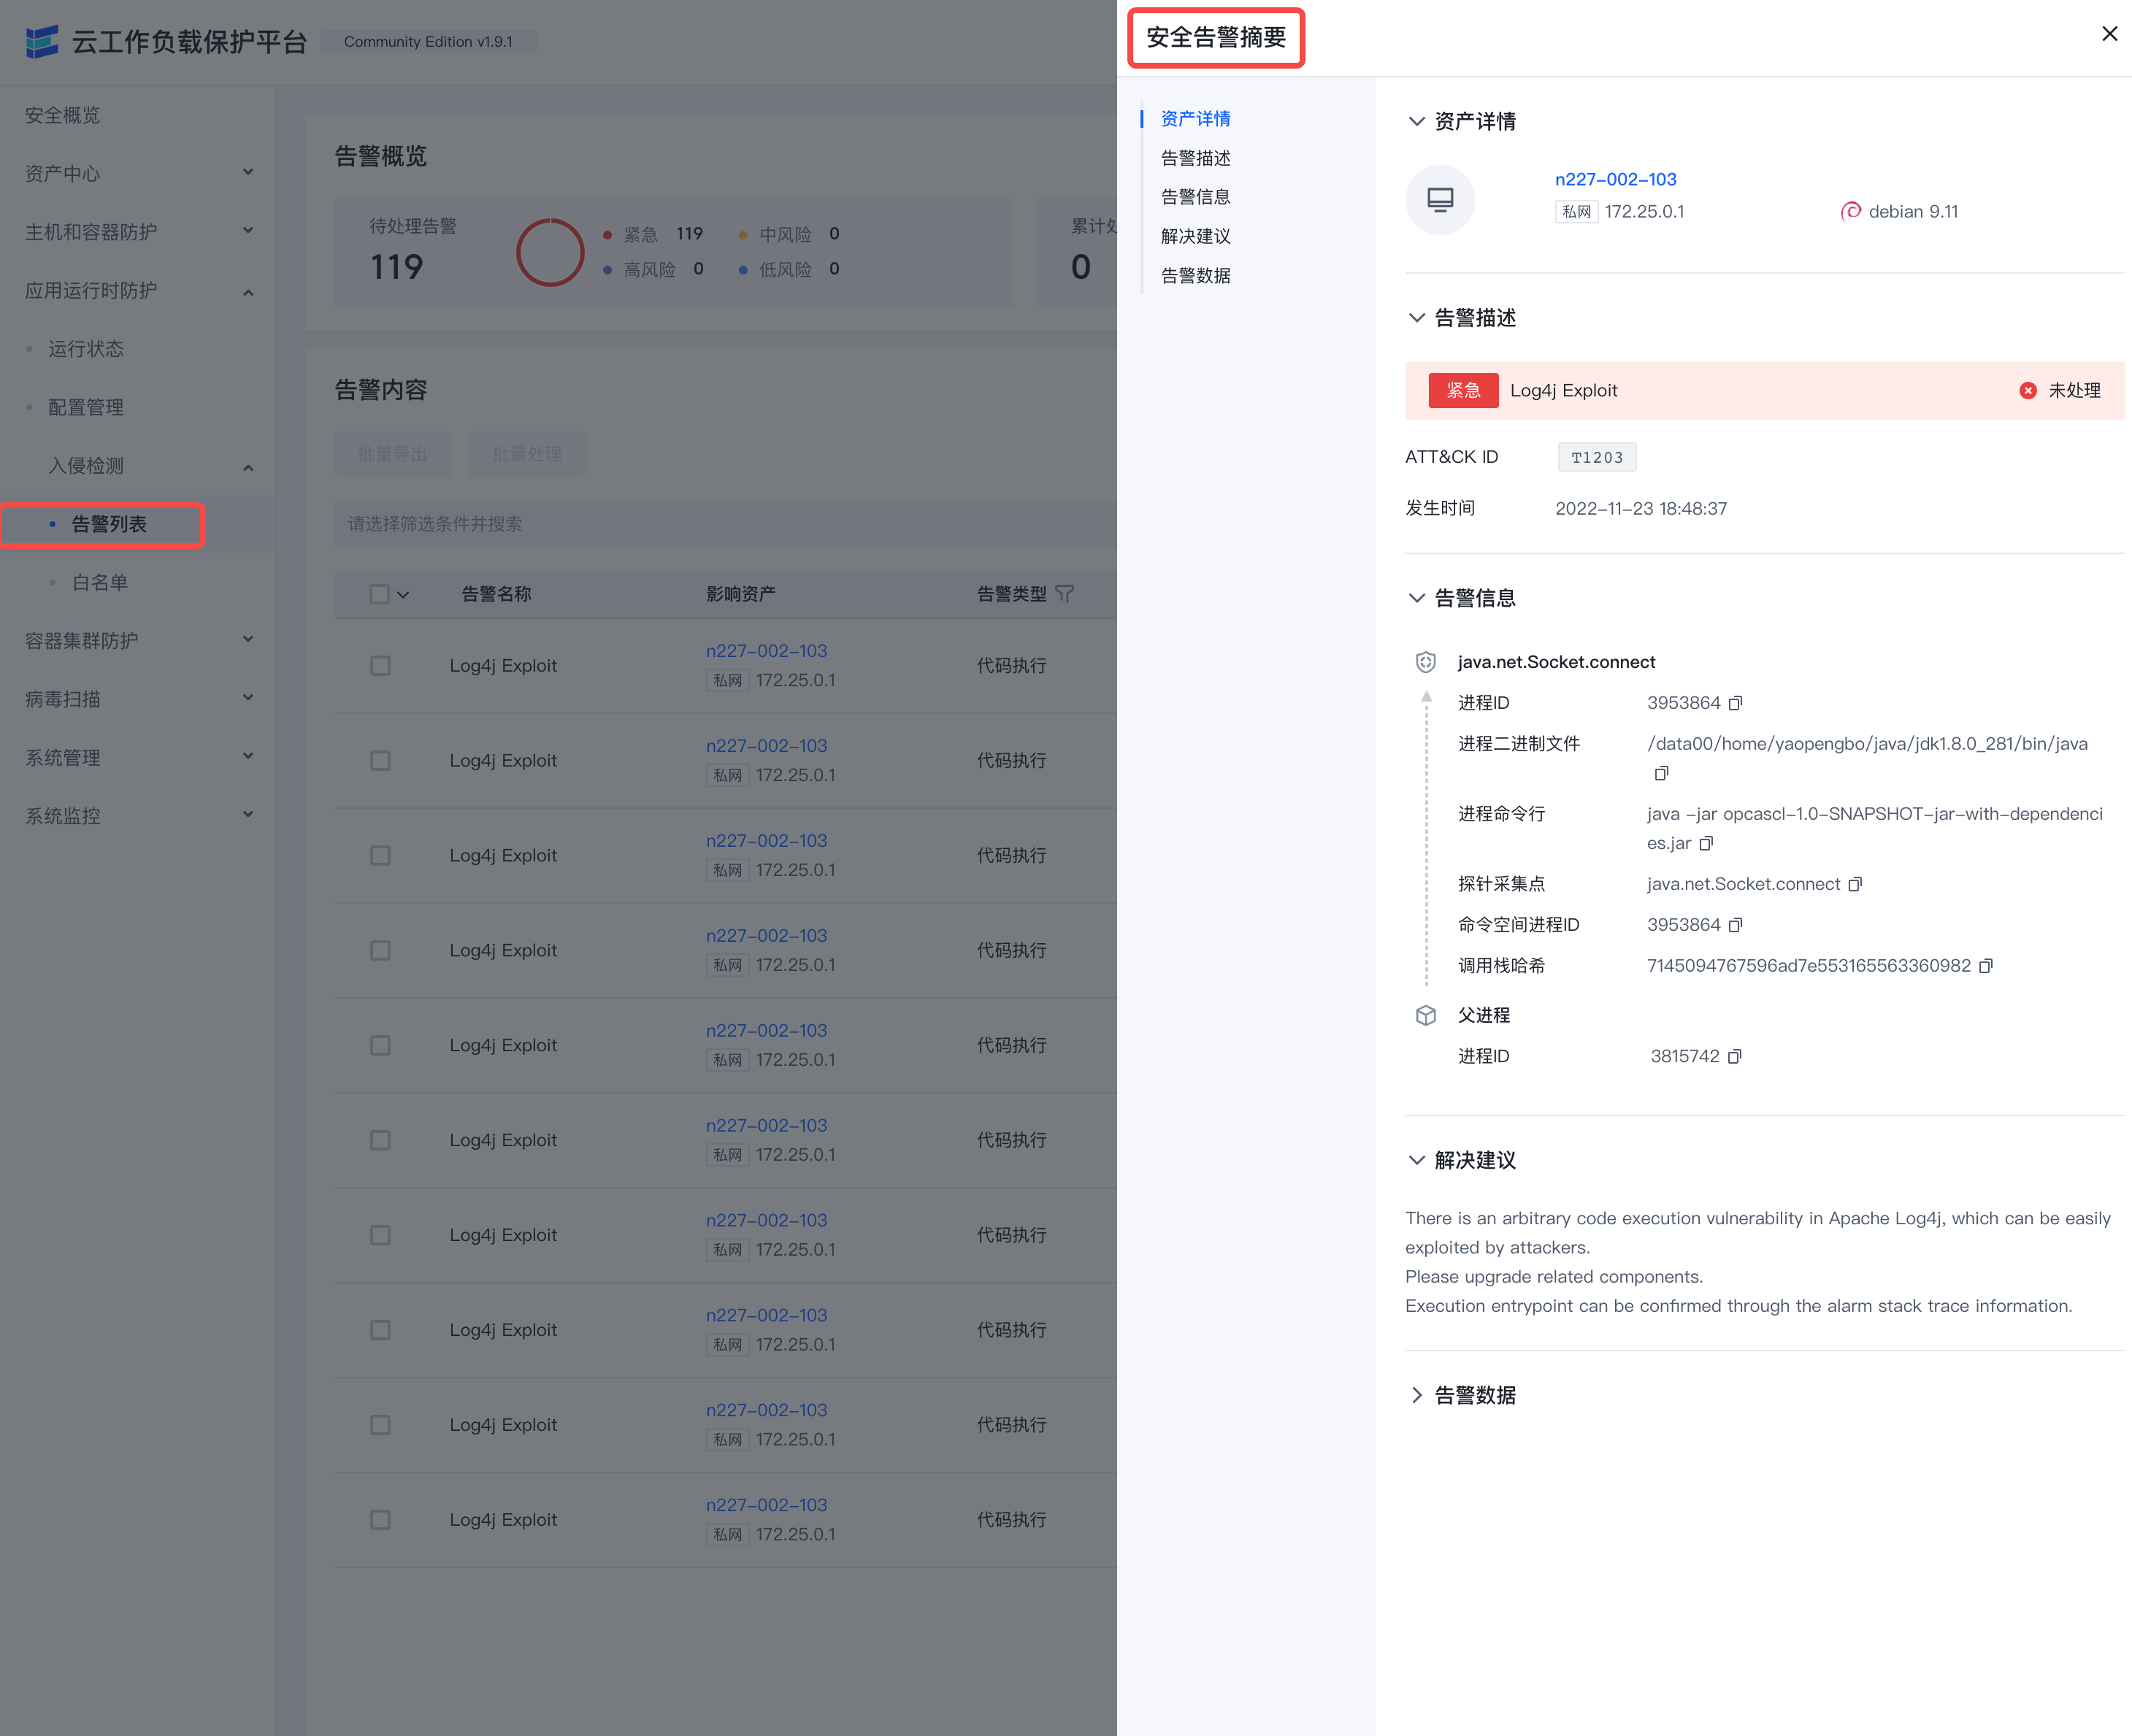
- The alarm data on the right can check parameter details and call stack
社区版与企业版能力差异
Elkeid Console社区版v1.9.1和企业版能力对比
| 功能 | Elkeid Community Edition | Elkeid Enterprise Edition |
| Linux 数据采集能力 | ✅ | ✅ |
| RASP 探针能力 | ✅ | ✅ |
| K8s Audit Log 采集能力 | ✅ | ✅ |
| Agent 控制面 | ✅ | ✅ |
| 主机状态与详情 | ✅ | ✅ |
| 勒索诱饵 | 🙅♂️ | ✅ |
| 资产采集 | ✅ | ✅ |
| 高级资产采集 | 🙅♂️ | ✅ |
| 容器集群资产采集 | ✅ | ✅ |
| 暴露面与脆弱性分析 | 🙅♂️ | ✅ |
| 主机/容器 基础入侵检测 | 少量样例 | ✅ |
| 主机/容器 行为序列入侵检测 | 🙅♂️ | ✅ |
| RASP 基础入侵检测 | 少量样例 | ✅ |
| RASP 行为序列入侵检测 | 🙅♂️ | ✅ |
| K8S 基础入侵检测 | 少量样例 | ✅ |
| K8S 行为序列入侵检测 | 🙅♂️ | ✅ |
| K8S 威胁分析 | 🙅♂️ | ✅ |
| 告警溯源(行为溯源) | 🙅♂️ | ✅ |
| 告警溯源(驻留溯源) | 🙅♂️ | ✅ |
| 告警白名单 | ✅ | ✅ |
| 多告警聚合能力 | 🙅♂️ | ✅ |
| 威胁处置(进程) | 🙅♂️ | ✅ |
| 威胁处置(网络) | 🙅♂️ | ✅ |
| 威胁处置(文件) | 🙅♂️ | ✅ |
| 文件隔离箱 | 🙅♂️ | ✅ |
| 漏洞检测 | 少量情报 | ✅ |
| 漏洞情报热更新 | 🙅♂️ | ✅ |
| 基线检查 | 少量基线 | ✅ |
| RASP 热补丁 | 🙅♂️ | ✅ |
| 病毒扫描 | ✅ | ✅ |
| 用户行为日志分析 | 🙅♂️ | ✅ |
| 插件管理 | ✅ | ✅ |
| 系统监控 | ✅ | ✅ |
| 系统管理 | ✅ | ✅ |
| Windows 支持 | 🙅♂️ | ✅ |
| 蜜罐 | 🙅♂️ | 🚘 |
| 主动防御 | 🙅♂️ | 🚘 |
| 云查杀 | 🙅♂️ | 🚘 |
| 防篡改 | 🙅♂️ | 🚘 |
Elkeid HUB 社区版和企业版能力对比
| 功能 | Elkeid HUB Community Edition | Elkeid HUB Enterprise Edition |
| 完全规则编写能力(详见Elkedi HUB社区版使用指南): 基础检测(等于/包含/以……开头/正则等) 阈值/频率/GROUP BY检测 多关键词检测 数组/复杂结构检测 CEP 节点检测能力 字段添加/修改/删除 插件联动能力 |
✅ |
✅ |
| 系统/用户管理能力 | ✅ | ✅ |
| 集群部署能力 | ❌ | ✅ |
| 多工作空间 | ❌ | ✅ |
| 输入/输出/规则集/项目组建操作能力 | ✅ | ✅ |
| 负载、规则监控能力 | ✅ | ✅ |
| 组件数据抽样能力 | ✅ | ✅ |
| 规则测试能力 | ✅ | ✅ |
| 数据表(MYSQL/REDIS/ClickHouse/Mongodb/ES)消费/规则关联能力 | ❌ | ✅ |
| 自定义插件能力 | ✅ | ✅ |
| 插件供外部调用能力 | ❌ | ✅ |
| 日志/事件监控能力 | ✅ | ✅ |
| 溯源/持久化能力 | ❌ | ✅ |
开源策略说明
HIDS开源策略列表
| 告警ID | 告警名 | 描述 | 告警类型 | 数据类型 | 等级 |
|---|---|---|---|---|---|
| hidden_module_detect | Hidden kernel module | Hidden Kernel Module Detected | 后门驻留 | Hooks | critical |
| bruteforce_single_source_detect | Bruteforce from single-source | Bruteforce from single source address | 暴力破解 | Log Monitor | medium |
| bruteforce_multi_source_detect | Bruteforce from multi-sources | Bruteforce from multiple source addresses | 暴力破解 | Log Monitor | medium |
| bruteforce_success_detect | Bruteforce success | Bruteforce login attempt ended with succesful password login | 暴力破解 | Log Monitor | critical |
| binary_file_hijack_detect1 | Binary file hijack | Common binary file hijacking, file creation detection | 变形木马 | execve | medium |
| binary_file_hijack_detect2 | Binary file hijack | Common binary file Hijacking, file renaming detection | 变形木马 | execve | critical |
| binary_file_hijack_detect3 | Binary file hijack | Common binary file hijacking, file linkage detection | 变形木马 | execve | critical |
| user_credential_escalation_detect | User credential escalation | Non-root user escalate to root privilege | 提权攻击 | Log Monitor | medium |
| privilege_escalation_suid_sgid_detect_1 | User credential escalation | Non-root user escalete privilege with suid/sgid | 提权攻击 | Log Monitor | medium |
| privilege_escalation_suid_sgid_detect_2 | User credential escalation | Non-root user escalete privilege with suid/sgid | 提权攻击 | execve | medium |
| reverse_shell_detect_basic | Reverse shell | Reverse Shell With Connection | 代码执行 | execve | critical |
| reverse_shell_detect_argv | Reverse shell | Reverse-shell-like argv during execution | 代码执行 | execve | high |
| reverse_shell_detect_exec | Reverse shell | Reverse shell with exec | 代码执行 | execve | high |
| reverse_shell_detect_pipe | Reverse shell | Reverse shell with pipe | 代码执行 | execve | high |
| reverse_shell_detect_perl | Reverse shell | Reverse shell with Perl | 代码执行 | execve | high |
| reverse_shell_detect_python | Reverse shell | Reverse shell with Python | 代码执行 | execve | high |
| bind_shell_awk_detect | Bind shell with awk | Suspecious bind shell with awk | 代码执行 | execve | high |
| pipe_shell_detect | Double-piped reverse shell | Double-piped reverse shell | 代码执行 | execve | high |
| suspicious_rce_from_consul_service_detect | Suspecious RCE like behavior | Suspecious RCE like behaviors from Consul service | 试探入侵 | execve | high |
| suspicious_rce_from_mysql_service_detect | Suspecious RCE like behavior | Suspecious RCE like behaviors from mysql service | 试探入侵 | execve | high |
| dnslog_detect1 | Suspecious query to dnslog | Suspecious dnslog like query on hosts | 试探入侵 | execve | high |
| dnslog_detect2 | Suspecious query to dnslog | Suspecious dnslog like query on hosts | 试探入侵 | execve | high |
| container_escape_mount_drive_detect | Container escape with mounted drive | Unnecessary behavior inside contianer, mount drive | 提权攻击 | execve | high |
| container_escape_usermode_helper_detect | Container escape with usermodehelper | Suspecious contianer escape with usermode helper | 提权攻击 | execve | high |
| signature_scan_maliciou_files_detect | Malicious files | Detected abnormal files with maliciou singnature | 静态扫描 | execve | high |
RASP开源策略列表
| 规则名称 | 运行时 | 规则描述 |
|---|---|---|
| JSP Command Execution | JVM | Discover the behavior of command execution from java server pages |
| Log4j Exploit | JVM | Detected exploit process for log4j |
| WebShell Behavior Detect | JVM | Suspected WebShell-like behavior found in JVM runtime |
| Command Execution Caused By FastJson Deserialization | JVM | FastJson deserializes attacker-constructed data, resulting in command execution |
| Command Execution In preg_replace Function | PHP | Unusual behavior of php preg_replace function for command execution |
| BeHinder WebShell Detect | PHP | BeHinder WebShell detect by PHP runtime stack trace |
K8S开源策略列表
k8s 开源策略列表
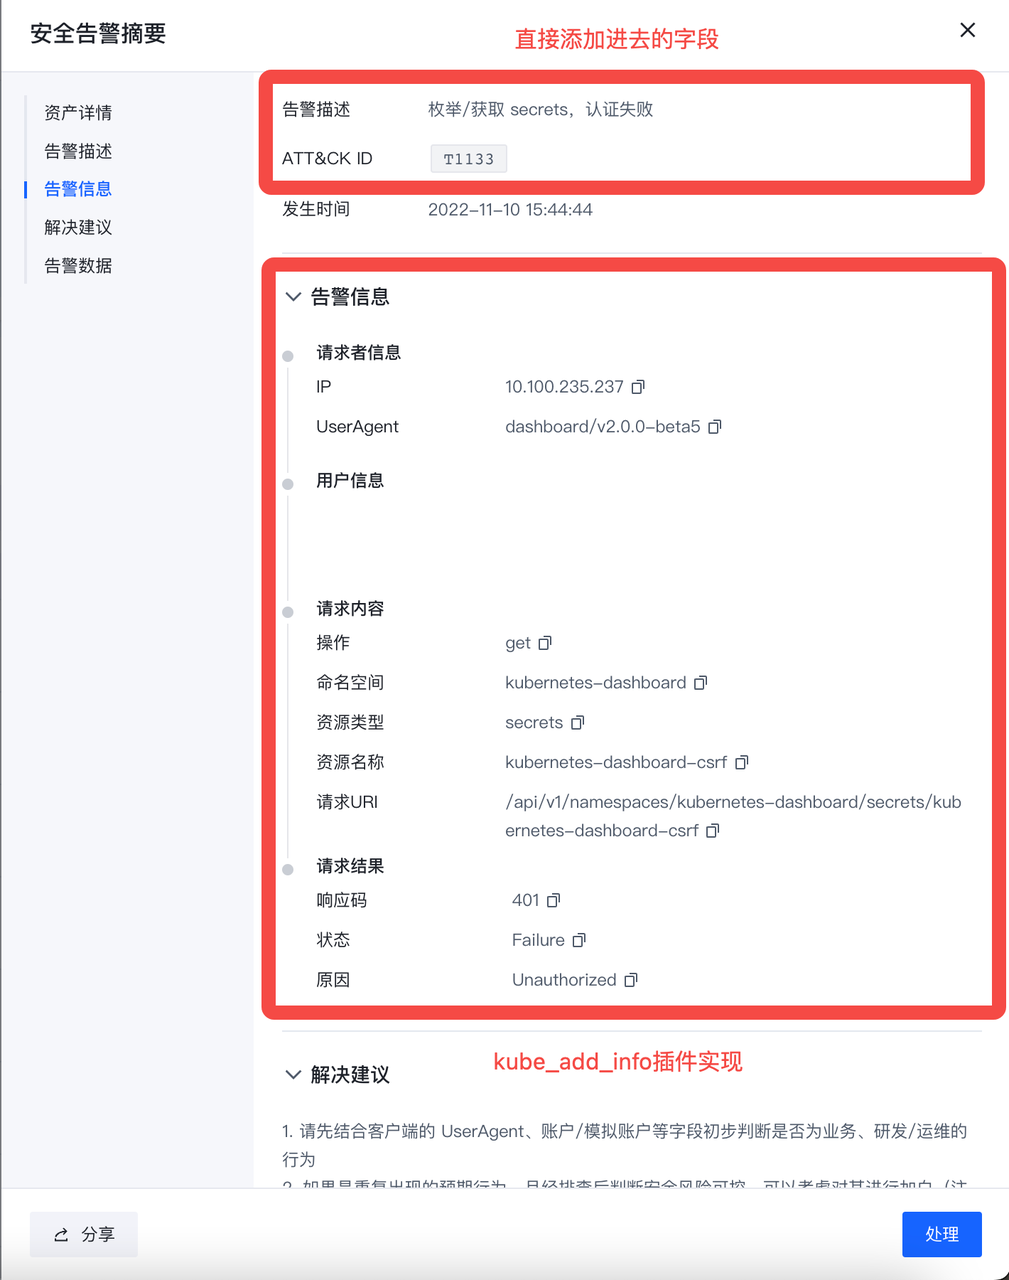
| 策略一级类别 | 策略二级类别 | 策略三级类别 / 告警名称(风险名称) | 告警描述 | 告警类型 | 严重等级 | ATT&CK ID | 风险说明 | 处置建议(含关注字段) |
|---|---|---|---|---|---|---|---|---|
| 异常行为 | 认证/授权失败 | 匿名访问 | 匿名用户访问 | 试探入侵 | high | T1133 | 检测到匿名用户访问集群,可能有人对集群进行探测攻击。 | 1. 通过 UserAgent,操作,请求 URI 等字段判断该操作是否是敏感操作,如果是则可能是有人对集群进行攻击,请通过源 IP 字段以及该 IP 关联的资产信息等来定位发起者身份,进一步排查。 2. 如果不是,则可以考虑对其进行加白处理(注意:建议结合多个字段进行加白,避免导致漏报) 关注字段:UserAgent,账户/模拟账户,动作,资源 |
| 认证失败 | 枚举/获取 secrets,认证失败 | 试探入侵 | low | T1133 | 枚举、获取集群保密字典(Secret)时出现认证失败。攻击者可能会尝试获取集群 secrets 用于后续攻击。 | 1. 请先结合客户端的 UserAgent、账户/模拟账户等字段初步判断是否为业务、研发/运维的行为 2. 如果是重复出现的预期行为,且经排查后判断安全风险可控,可以考虑对其进行加白(注意:建议结合多个字段进行加白,避免导致漏报) 3. 如果是非预期行为,请通过源 IP 字段以及该 IP 关联的资产信息等来定位发起者身份,进一步排查 关注字段:UserAgent, 账户/模拟账户,动作,资源名字 |
||
| 授权失败 | 枚举/获取 secrets,授权失败 | 试探入侵 | medium | T1133 | 枚举、获取集群保密字典(Secret)时出现授权失败。攻击者可能会尝试获取 secrets 用于后续攻击。 | 1. 请先结合客户端的 UserAgent、账户/模拟账户等字段初步判断是否为业务、研发/运维的行为 2. 如果是重复出现的预期行为,且经排查后判断安全风险可控,可以考虑对其进行加白(注意:建议结合多个字段进行加白,避免导致漏报) 3. 如果是非预期行为,请通过源 IP 字段以及该 IP 关联的资产信息等来定位发起者身份,进一步排查 关注字段:UserAgent, 账户/模拟账户,动作,资源名字 |
||
| 凭据滥用 | 凭据滥用 | 利用 kubectl 滥用 ServiceAccount | 试探入侵 | critical | T1078, T1133 | 通过 kubectl 客户端工具以 SA 账户身份访问 k8s API Server。攻击者窃取到某个 SA token 后,然后通过 kubectl 工具,附带窃取的 token 向 API Server 发起请求来进行攻击。 | 1. 请先通过UserAgent、账户/模拟账户、动作、资源等字段确认是否为预期业务行为 2. 如果是重复出现的预期行为,且经排查后判断安全风险可控,可以考虑对其进行加白(注意:建议结合多个字段进行加白,避免导致漏报) 3. 如果是非预期行为,请通过源 IP 字段以及该 IP 关联的资产信息等来定位发起者身份,进一步排查 关注字段:UserAgent,账户/模拟账户,动作,资源 |
|
| 外部代码执行 | 外部代码执行 | 与 API Server 交互,在 pods 内执行命令 | 代码执行 | medium | T1609 | 通过 pods/exec (即 kubectl exec 对应的子资源)在容器内执行任意命令(创建交互式 bash、执行其他命令)。攻击者可能会通过创建 pods/exec 子资源在容器中执行任意命令,从而实现横向移动攻击、凭据窃取等。本策略记录所有的 pods/exec 行为。 | 1. 请先通过UserAgent、账户/模拟账户、执行命令等字段确认是否为预期业务行为 2. 如果是重复出现的预期行为,且经排查后判断安全风险可控,可以考虑对其进行加白(注意:建议结合多个字段进行加白,避免导致漏报) 3. 如果是非预期行为,请通过源 IP 字段以及该 IP 关联的资产信息等来定位发起者身份,进一步排查 关注字段:UserAgent,账户/模拟账户,执行命令 |
|
| 威胁资源 | Workloads 部署 | 特权容器 | 创建具有特权容器的工作负载 | 提权攻击 | critical | T1611, T1610 | 监测到有特权容器创建。攻击者可能会通过创建特权容器来横向移动并获取宿主机的控制权。业务在部署服务时,也可能会创建特权容器,如果容器被攻击,则可以轻易实现逃逸,因此非必要不创建。 | 1. 请先通过容器所属的业务等字段确认是否为预期业务行为 2. 如果是重复出现的预期行为,且经排查后判断安全风险可控,可以考虑对其进行加白(注意:建议结合多个字段进行加白,避免导致漏报) 3. 如果是非预期行为,请通过源 IP 字段以及该 IP 关联的资产信息等来定位发起者身份,进一步排查 关注字段:容器所属的业务,UserAgent, 账户/模拟账户 |
| 挂载宿主机敏感文件 | 创建挂载宿主机敏感文件的工作负载 | 提权攻击 | critical | T1611, T1610 | 创建的容器挂载了宿主机上的敏感目录或文件,比如根目录目录,/proc目录等。 攻击者可能会创建挂载宿主机敏感目录、文件的容器来提升权限,获取宿主机的控制权并躲避检测。当合法的业务创建挂载宿主机敏感目录、文件的容器时,也会给容器环境带来安全隐患。 针对前者需要进一步排查异常,针对后者需联系业务进行持续的安全合规整改。 |
1. 请先通过容器所属的业务等字段确认是否为预期业务行为 2. 如果是重复出现的预期行为,且经排查后判断安全风险可控,可以考虑对其进行加白(注意:建议结合多个字段进行加白,避免导致漏报) 3. 如果是非预期行为,请通过源 IP 字段以及该 IP 关联的资产信息等来定位发起者身份,进一步排查 关注字段:容器所属的业务,UserAgent,账户/模拟账户,镜像 |
||
| RoleBinding、ClusterRoleBinding 创建 | 创建不安全的 ClusterRole | 创建绑定大权限 ClusterRole 的 ClusterRoleBinding | 后门驻留 | high | T1078 | 创建的 ClusterRoleBinding 绑定了敏感的 ClusterRole,即将某个用户、用户组或服务账户赋予敏感的 ClusterRole 的权限。攻击者可能会为持久化、隐蔽性而创建绑定大权限 ClusterRole 的 ClusterRoleBinding。集群管理员或运维人员也可能会因安全意识不足而创建绑定大权限 ClusterRole 的 ClusterRoleBinding。根据权限最小化原则和 k8s 安全攻防实践,此类 ClusterRoleBinding 会给集群引入较大的安全风险,因此应该极力避免。 | 1. 请先结合客户端的 UserAgent、账户/模拟账户等字段初步判断是否为业务、研发/运维的行为 2. 如果是运维人员在进行角色绑定,则可以将告警设置为已处理。 3. 如果是重复出现的预期行为,且经排查后判断安全风险可控,可以考虑对其进行加白(注意:建议结合多个字段进行加白,避免导致漏报) 4. 如果是非预期行为,请通过源 IP 字段以及该 IP 关联的资产信息等来定位发起者身份,进一步排查 关注字段:UserAgent, 账户/模拟账户,主体名字,角色名字 |
|
| 漏洞利用行为 | N/A | 疑似 CVE-2020-8554 | 疑似存在通过创建、更新 Service 的 externalIPs 来利用 CVE-2020-8554 的利用行为 | 信息搜集 | high | T1557 | 检测到 CVE-2020-8554 的利用特征——创建、更新 Service 并设置 externalIPs。此漏洞的利用途径之一为 创建、更新 Service 时设置了恶意 spec.externalIPs 从而实现中间人攻击。根据实践,Service 的 ExternalIP 属性很少被使用。因此当发生这种行为时,需要运营人员进一步核实 ExternalIP 是否为合法的 IP 地址。 | 1. 请先通过UserAgent、账户/模拟账户等字段以及原始日志中的 requestObject.spec.externalIPs 的值确认是否为预期业务行为 2. 如果是重复出现的预期行为,且经排查后判断安全风险可控,可以考虑对其进行加白(注意:建议结合多个字段进行加白,避免导致漏报) 3. 如果是非预期行为,请通过源 IP 字段以及该 IP 关联的资产信息等来定位发起者身份,进一步排查 关注字段:UserAgent, 账户/模拟账户, requestObject.spec.externalIPs |
K8S开源策略编写说明
数据源
K8S策略基于K8S Audit Logs数据,具体的Audit Policy可以在平台中下载。在Console中配置好后,数据会经Agent Center上开启的Webhook写入到Kafka的k8stopic。也可以直接使用HUB中自带的k8s INPUT作为数据源。
开源策略说明
Project
在v1.9.1社区版中,我们编写了一部分示例策略用于开源,对应的HUB Project为kube_example和kube_workload。kube_example存放的策略为基础策略,kube_workload存放的为需要对数据进行处理后再进行检测的策略。
- kube_example
  INPUT.k8s --> RULESET.kube_detect
  RULESET.kube_detect --> RULESET.kube_alert_info
  RULESET.kube_alert_info --> RULESET.kube_add_cluster_info
  RULESET.kube_add_cluster_info --> RULESET.kube_push_alert
- kube_workload
  INPUT.k8s --> RULESET.kube_workloads
  RULESET.kube_workloads --> RULESET.kube_filter_workloads
  RULESET.kube_filter_workloads --> RULESET.kube_handle_workloads
  RULESET.kube_handle_workloads --> RULESET.kube_detect_workloads
  RULESET.kube_detect_workloads  --> RULESET.kube_alert_info
  RULESET.kube_alert_info --> RULESET.kube_add_cluster_info
  RULESET.kube_add_cluster_info --> RULESET.kube_push_alert
Ruleset
下面为一些调用HUB内置插件的规则集进行补充说明,其余规则可以直接在HUB前端进行查看。
kube_alert_info规则集对检出的告警添加告警数据字段,同时调用Kube_add_info插件添加告警的基础信息。该插件为HUB内置Modify插件,因此可以按需调用。
kube_add_cluster_info规则集调用Manager接口通过集群id获取集群信息,该流程通过调用KubeAddClusterInfo插件实现。该插件为HUB内置Modify插件。
kube_push_alert规则集调用Manager接口推送告警,该流程通过调用KubePushMsgToLeader插件实现。该插件为HUB内置Action插件。
下图为告警内容说明:
 workload相关检测策略通过Python Plugin进行实现,该插件于kube_handle_workloads中调用。
编写建议
在编写其余告警策略时,需要分别调用kube_alert_info、kube_add_cluster_info、kube_push_alert进行告警的信息填充,集群信息添加,告警的推送。如果新增告警类型,需要在kube_alert_info中进行添加,补充相关字段。
Elkeid - Bytedance Cloud Workload Protection Platform
Elkeid is an open source solution that can meet the security requirements of various workloads such as hosts, containers and K8s, and serverless. It is derived from ByteDance's internal best practices.
With the business development of enterprises, the situation of multi-cloud, cloud-native, and coexistence of multiple workloads has become more and more prominent. We hope that there can be a set of solutions that can meet the security requirements under different workloads, so Elkeid was born.
Introduction
Elkeid has the following key capabilities:
-
Elkeid not only has the traditional HIDS (Host Intrusion Detection System) ability for host layer intrusion detection and malicious file identification, but also can well identify malicious behaviors in containers. The host can meet the anti-intrusion security requirements of the host and the container on it, and the powerful kernel-level data collection capability at the bottom of Elkeid can satisfy the desire of most security analyst for host-level data.
-
For the running business Elkeid has the RASP capability and can be injected into the business process for anti-intrusion protection, not only the operation and maintenance personnel do not need to install another Agent, but also the business does not need to restart.
-
For K8s itself, Elkeid supports collection to K8s Audit Log to perform intrusion detection and risk identification on the K8s system.
-
Elkeid's rule engine Elkeid HUB can also be well linked with external multiple systems.
Ekeid integrates these capabilities into one platform to meet the complex security requirements of different workloads, while also achieving multi-component capability association. What is even more rare is that each component undergoes massive byte-beating. Data and years of combat testing.
Elkeid Community Edition Description
It should be noted that there are differences between the Elkeid open source version and the full version. The current open source capabilities mainly include:
- All on-device capabilities, that is, on-device data/asset/partial collection capabilities, kernel-state data collection capabilities, RASP probe parts, etc., and are consistent with the internal version of ByteDance;
- All backend capabilities, namely Agent Center, service discovery, etc., are consistent with the internal version of ByteDance;
- Provide a community edition rule engine, namely Elkeid HUB, and use it as an example with a small number of strategies;
- Provides community version of Elkeid Console and some supporting capabilities.
Therefore, it is necessary to have complete anti-intrusion and risk perception capabilities, and it is also necessary to construct policies based on Elkeid HUB and perform secondary processing of the data collected by Elkeid.
Elkeid Architecture
Elkeid Host Ability
- Elkeid Agent Linux userspace agent,responsible for managing various plugin, communication with Elkeid Server.
- Elkeid Driver Driver can collect data on Linux Kernel, support container runtime , communication with Elkeid Driver Plugin.
- Elkeid RASP Support CPython、Golang、JVM、NodeJS、PHP runtime probe, supports dynamic injection into the runtime.
- Elkeid Agent Plugin List
- Driver Plugin: Responsible for managing Elkeid Driver, and process the driver data.
- Collector Plugin: Responsible for the collection of assets/log information on the Linux System, such as user list, crontab, package information, etc.
- Journal Watcher: Responsible for monitoring systemd logs, currently supports ssh related log collection and reporting.
- Scanner Plugin: Responsible for static detection of malicious files on the host, currently supports yara.
- RASP Plugin: Responsible for managing RASP components and processing data collected from RASP.
- Baseline Plugin: Responsible for detecting baseline risks based on baseline check policies.
- Elkeid Data Format
- Elkeid Data Usage Tutorial
Elkeid Backend Ability
- Elkeid AgentCenter Responsible for communicating with the Agent, collecting Agent data and simply processing it and then summing it into the MQ, is also responsible for the management of the Agent, including Agent upgrade, configuration modification, task distribution, etc.
- Elkeid ServiceDiscovery Each component in the background needs to register and synchronize service information with the component regularly, so as to ensure that the instances in each service module are visible to each other and facilitate direct communication.
- Elkeid Manager Responsible for the management of the entire backend, and provide related query and management API.
- Elkeid Console Elkeid Front-end
- Elkeid HUB Elkeid HIDS RuleEngine
Elkeid Function List
| Ability List | Elkeid Community Edition | Elkeid Enterprise Edition |
|---|---|---|
| Linux runtime data collection | :white_check_mark: | :white_check_mark: |
| RASP probe | :white_check_mark: | :white_check_mark: |
| K8s Audit Log collection | :white_check_mark: | :white_check_mark: |
| Agent control plane | :white_check_mark: | :white_check_mark: |
| Host Status and Details | :white_check_mark: | :white_check_mark: |
| Extortion bait | :ng_man: | :white_check_mark: |
| Asset collection | :white_check_mark: | :white_check_mark: |
| Asset Collection Enhancements | :ng_man: | :white_check_mark: |
| K8s asset collection | :white_check_mark: | :white_check_mark: |
| Exposure and Vulnerability Analysis | :ng_man: | :white_check_mark: |
| Host/Container Basic Intrusion Detection | few samples | :white_check_mark: |
| Host/Container Behavioral Sequence Intrusion Detection | :ng_man: | :white_check_mark: |
| RASP Basic Intrusion Detection | few samples | :white_check_mark: |
| RASP Behavioral Sequence Intrusion Detection | :ng_man: | :white_check_mark: |
| K8S Basic Intrusion Detection | few samples | :white_check_mark: |
| K8S Behavioral Sequence Intrusion Detection | :ng_man: | :white_check_mark: |
| K8S Threat Analysis | :ng_man: | :white_check_mark: |
| Alarm traceability (behavior traceability) | :ng_man: | :white_check_mark: |
| Alarm traceability (resident traceability) | :ng_man: | :white_check_mark: |
| Alert Whitelist | :white_check_mark: | :white_check_mark: |
| Multi-alarm aggregation capability | :ng_man: | :white_check_mark: |
| Threat Repsonse (Process) | :ng_man: | :white_check_mark: |
| Threat Repsonse (Network) | :ng_man: | :white_check_mark: |
| Threat Repsonse (File) | :ng_man: | :white_check_mark: |
| File isolation | :ng_man: | :white_check_mark: |
| Vulnerability discovery | few vuln info | :white_check_mark: |
| Vulnerability information hot update | :ng_man: | :white_check_mark: |
| Baseline check | few baseline rules | :white_check_mark: |
| Application Vulnerability Hotfix | :ng_man: | :white_check_mark: |
| Virus scan | :white_check_mark: | :white_check_mark: |
| User behavior log analysis | :ng_man: | :white_check_mark: |
| Agent Plugin management | :white_check_mark: | :white_check_mark: |
| System monitoring | :white_check_mark: | :white_check_mark: |
| System Management | :white_check_mark: | :white_check_mark: |
| Windows Support | :ng_man: | :white_check_mark: |
| Honey pot | :ng_man: | :oncoming_automobile: |
| Active defense | :ng_man: | :oncoming_automobile: |
| Cloud virus analysis | :ng_man: | :oncoming_automobile: |
| File-integrity monitoring | :ng_man: | :oncoming_automobile: |
Front-end Display (Community Edition)
Security overview
K8s security alert list
K8s pod list
Host overview
Resource fingerprint
intrusion alert overwiew
Vulnerability
Baseline check
Virus scan
Backend hosts monitoring
Backend service monitoring
Console User Guide
Quick Start
Contact us && Cooperation
Lark Group
About Elkeid Enterprise Edition
Elkeid Enterprise Edition supports separate intrusion detection rules(like the HIDS, RASP, K8s) sales, as well as full capacity sales.
If interested in Elkeid Enterprise Edition please contact elkeid@bytedance.com
Elkeid Docs
For more details and latest updates, see Elkeid docs.
License
- Elkeid Driver: GPLv2
- Elkeid RASP: Apache-2.0
- Elkeid Agent: Apache-2.0
- Elkeid Server: Apache-2.0
- Elkeid Console: Elkeid License
- Elkeid HUB: Elkeid License
404StarLink 2.0 - Galaxy
Elkeid has joined 404Team 404StarLink 2.0 - Galaxy
![]()

About Elkeid Agent
Agent provides basic capability support for components on the host, including data communication, resource monitoring, component version control, file transfer, and host basic information collection.
Agent itself does not provide security capabilities, and operates as a system service as a plugin base. The policies of various functional plugins are stored in the server-side configuration, and after the Agent receives the corresponding control instructions and configuration, it will open, close, and upgrade itself and the plugins.
Bi-stream gRPC is used for communication between Agent and Server, and mutual TLS verification is enabled based on self-signed certificates to ensure transport security. Among them, the flow of information in the direction of Agent -> Server is called data flow, and the flow of information in the direction of Server -> Agent is generally control flow, using different message types of protobuf. The Agent itself supports client-side service discovery, and also supports cross-Region level communication configuration. It realizes that an Agent package can be installed in multiple network isolation environments. Based on a TCP connection at the bottom layer, two data transmissions, Transfer and FileOp, are realized in the upper layer. The service supports the data reporting of the plugin itself and the interaction with the files in the Host.
Plugins, as security capability plugins, generally have a "parent-child" process relationship with the Agent. Using two pipes as the cross-process communication method, the plugins lib provides two plugin libraries for Go and Rust, which are responsible for encoding and sending plugin-side information. It is worth mentioning that after the plugin sends data, it will be encoded as Protobuf binary data. After the Agent receives it, there is no need to decode it twice, and then splices the Header feature data in the outer layer and transmits it directly to the server. Generally, the server does not need to Decoding is directly transmitted to the subsequent data stream, and decoding is performed when used, which reduces the additional performance overhead caused by multiple encoding and decoding in data transmission to a certain extent.
The Agent is implemented in Go. Under Linux, systemd is used as a guardian to control resource usage by cgroup restrictions. It supports aarch64 and x86-64 architectures. It is finally compiled and packaged as deb and rpm packages for distribution. The formats are in line with systemd, Debian, and RHEL specifications. , which can be directly provided to the corresponding software repository for subsequent version maintenance. In subsequent versions, Agent for Windows platform will be released.
Runtime Requirements
Most of the functions provided by Agent and Plugin need to run at the host level with root privileges. In containers with limited privileges, some functions may be abnormal.
Quick Start
Through the complete deployment of elkeidup, you can directly obtain the installation package for Debian/RHEL series distributions, and deploy according to the commands of the Elkeid Console - Installation Configuration page.
Compile from source
Dependency Requirements
Confirm related configuration
- Make sure that the three files
ca.crt,client.key, andclient.crtin thetransport/connectiondirectory are the same as the files with the same name in the Agent Center'sconfdirectory. - Make sure the parameters in the
transport/connection/product.gofile are properly configured:- If it is a manually deployed Server:
serviceDiscoveryHost["default"]needs to be assigned to the intranet listening address and port of the ServiceDiscovery service or its proxy, for example:serviceDiscoveryHost["default"] = "192.168.0.1: 8088"privateHost["default"]needs to be assigned to the intranet listening address and port of the AgentCenter service or its proxy, for example:privateHost["default"] = "192.168.0.1: 6751"- If there is a public network access point of the Server,
publicHost["default"]needs to be assigned to the external network listening address and port of the AgentCenter service or its proxy, for example:publicHost[ "default"]="203.0.113.1:6751"
- If the Server is deployed through elkeidup, the corresponding configuration can be found according to the
~/.elkeidup/elkeidup_config.yamlfile of the deployed Server host:- Find the IP of the Nginx service in the configuration file, the specific configuration item is
nginx.sshhost[0].host - Find the IP of the ServiceDiscovery service in the configuration file, the specific configuration item is
sd.sshhost[0].host serviceDiscoveryHost["default"]needs to be assigned the IP of the ServiceDiscovery service and set the port number to 8088, for example:serviceDiscoveryHost["default"] = "192.168.0.1 :8088"privateHost["default"]needs to be assigned the IP of the Nginx service, and set the port number to 8090, for example:privateHost["default"] = "192.168.0.1:8090"
- Find the IP of the Nginx service in the configuration file, the specific configuration item is
- If it is a manually deployed Server:
Compile
Chage to the root directory of agent source code, execute:
BUILD_VERSION=1.7.0.24 bash build.sh
During the compilation process, the script will read the BUILD_VERSION environment variable to set the version information, which can be modified according to actual needs.
After the compilation is successful, in the output directory of the root directory, you should see 2 deb and 2 rpm files, which correspond to different systems and architectures.
Version Upgrade
- If no client component has been created, please create a new component in the Elkeid Console-Component Management page.
- On the Elkeid Console - Component Management page, find the "elkeid-agent" entry, click "Release Version" on the right, fill in the version information and upload the files corresponding to the platform and architecture, and click OK.
- On the Elkeid Console - Component Policy page, delete the old "elkeid-agent" version policy (if any), click "New Policy", select the version just released, and click OK. Subsequent newly installed Agents will be self-upgraded to the latest version.
- On the Elkeid Console - Task Management page, click "New Task", select all hosts, click Next, select the "Sync Configuration" task type, and click OK. Then, find the task you just created on this page, and click Run to upgrade the old version of the Agent.
License
Elkeid Agent is distributed under the Apache-2.0 license.
![]()
System Architecture
Overview
Elkeid Server contains 5 modules::
- AgentCenter (AC) is responsible for communicating with the Agent, collecting Agent data and simply processing and then writing to the Kafka cluster. At the same time, it is also responsible for the management of the Agent, including Agent upgrade, configuration modification, task distribution, etc. In addition, the AC also provides HTTP services, through which the Manager manages the AC and the Agent.
- In ServiceDiscovery (SD), each service module needs to register with SD regularly and synchronize service information, so as to ensure that the instances in each service module are visible to each other and facilitate direct communication. Since SD maintains the status information of each registered service, when a service user requests service discovery, SD will perform load balancing. For example, the Agent requests a list of AC instances, and SD directly returns the AC instance with the least load pressure.
- Manager is responsible for managing the entire back-end and providing related query and management interfaces. Including the management of the AC cluster, monitoring the status of the AC, and managing all agents through the AC, collecting the running status of the agent, and delivering tasks to the agent. At the same time, the manager also manages real-time and offline computing clusters.
- Elkeid Console: Elkeid web console。
- Elkeid HUB : Elkeid HIDS RuleEngine。
In short, AgentCenter collects Agent data, real-time/offline calculation module analyzes and processes the collected data, Manager manages AgentCenter and computing module, ServiceDiscovery connects all services and nodes.
Features
- Backend infrastructure solutions for million-level Agent
- Distributed, decentralized, highly available cluster
- Simple deployment, few dependencies and easy maintenance
Deployment document
Build
- AgentCenter(AC): Executing './build.sh' in
Elkeid/server/agent_centerdirectory will generate the product' bin.tar.gz 'in the output directory. - ServiceDiscovery(SD):Executing
Elkeid/server/service_discoverydirectory will generate the product' bin.tar.gz 'in the output directory. - Manager:Executing
Elkeid/server/managerdirectory will generate the product' bin.tar.gz 'in the output directory.
Upgrade
Refer to the backend section of Build Elkeid CWPP from Source to deploy or upgrade.
Console User Guide
License
Elkeid Server are distributed under the Apache-2.0 license.
![]()
About Elkeid(AgentSmith-HIDS) Driver
Elkeid Driver is a one-of-a-kind Kernel Space HIDS agent designed for Cyber-Security.
Elkeid Driver hooks kernel functions via Kprobe, providing rich and accurate data collection capabilities, including kernel-level process execve probing, privilege escalation monitoring, network audition, and much more. The Driver treats Container-based monitoring as a first-class citizen as Host-based data collection by supporting Linux Namespace. Compare to User Space agents on the market, Elkeid provides more comprehensive information with massive performance improvement.
Elkeid has already been deployed massively for HIDS usage in world-class production environments. With its marvelous data collection ability, Elkeid also supports Sandbox, Honeypot, and Audition data requirements.
Notice
DO NOT insmod the ko in the production machines if you have not well tested it.
Quick Test
First you need install Linux Headers
# clone and build
git clone https://github.com/bytedance/Elkeid.git
cd Elkeid/driver/LKM/
make clean && make
< CentOS only: run build script instead >
sh ./centos_build_ko.sh

# load and test (should run as root)
insmod hids_driver.ko
dmesg | tail -n 20
test/rst -q
< "CTRL + C" to quit >

# unload
rmmod hids_driver
Pre-build Ko
How To Get
If all urls failed, please build elkeid kernel module yourself.
wget "http://lf26-elkeid.bytetos.com/obj/elkeid-download/ko/hids_driver_1.7.0.10_$(uname -r)_amd64.ko"
How to Test
You can test the kernel module with LTP (better with KASAN turned on). Here's the LTP-test-case configuration file for your reference: LTP-test-case.
About the compatibility with Linux distributions
| Distro | Version | x64 kernel | Suffix |
|---|---|---|---|
| Debian | 8,9,10 | 3.16~5.4.X | - |
| Ubuntu | 14.04,16.04,18.04,20.04 | 3.12~5.4.X | generic |
| CentOS | 6.X,7.X,8.X | 2.6.32.0~5.4.X | el6,el7,el8 |
| Amazon | 2 | 4.9.X~4.14.X | amzn2 |
| AlibabaCloudLinux | 3 | 4.19.X~5.10.X | al7,al8 |
| EulerOS | V2.0 | 3.10.X | - |
About ARM64 (AArch64) Support
- Yes
About the compatibility with Kernel versions
- Linux Kernel Version >= 2.6.32 && <= 6.3
About the compatibility with Containers
| Source | Nodename |
|---|---|
| Host | hostname |
| Docker | container name |
| K8s | pod name |
Hook List
| Hook | DataType | Note | Default |
|---|---|---|---|
| write | 1 | OFF | |
| open | 2 | OFF | |
| mprotect | 10 | only PROT_EXEC | OFF |
| nanosleep | 35 | OFF | |
| connect | 42 | ON | |
| accept | 43 | OFF | |
| bind | 49 | ON | |
| execve | 59 | ON | |
| process exit | 60 | OFF | |
| kill | 62 | OFF | |
| rename | 82 | ON | |
| link | 86 | ON | |
| ptrace | 101 | only PTRACE_POKETEXT or PTRACE_POKEDATA | ON |
| setsid | 112 | ON | |
| prctl | 157 | only PR_SET_NAME | ON |
| mount | 165 | ON | |
| tkill | 200 | OFF | |
| exit_group | 231 | OFF | |
| memfd_create | 356 | ON | |
| dns query | 601 | ON | |
| create_file | 602 | ON | |
| load_module | 603 | ON | |
| update_cred | 604 | only old uid ≠0 && new uid == 0 | ON |
| unlink | 605 | OFF | |
| rmdir | 606 | OFF | |
| call_usermodehelper_exec | 607 | ON | |
| file_write | 608 | OFF | |
| file_read | 609 | OFF | |
| usb_device_event | 610 | ON | |
| privilege_escalation | 611 | ON | |
| port-scan detection | 612 | tunable via module param: psad_switch | OFF |
Anti Rootkit List
| Rootkit | DataType | Default |
|---|---|---|
| interrupt table hook | 703 | ON |
| syscall table hook | 701 | ON |
| proc file hook | 700 | ON |
| hidden kernel module | 702 | ON |
Driver TransData Pattern
Data Protocol
Every hit of the hook-points above will generate a record, and the records are separated by deliminator '\x17'.
Each record contains several data items, which are separated by deliminator '\x1e'.
A record generally contains Common Data and Private Data, with the exception of Anti-rootkit, which does NOT have Common Data.
Common Data
-------------------------------------------------------------------------------
|1        |2  |3  |4  |5   |6   |7   |8  |9   |10      |11       |12 |13      |
-------------------------------------------------------------------------------
|data_type|uid|exe|pid|ppid|pgid|tgid|sid|comm|nodename|sessionid|pns|root_pns|
-------------------------------------------------------------------------------
Write Data (1)
-----------
|14   |15 |
-----------
|file||buf|
-----------
Open Data (2)
---------------------
|14   |15  |16      |
---------------------
|flags|mode|filename|
---------------------
Mprotect Data (10)
-----------------------------------------------------
|14           |15       |16        |17     |18      |
-----------------------------------------------------
|mprotect_prot|owner_pid|owner_file|vm_file|pid_tree|
-----------------------------------------------------
Nanosleep Data (35)
----------
|14 |15  |
----------
|sec|nsec|
----------
Connect Data (42)
-----------------------------------
|14       |15 |16   |17 |18   |19 |
-----------------------------------
|sa_family|dip|dport|sip|sport|res|
-----------------------------------
Accept Data (43)
-----------------------------------
|14       |15 |16   |17 |18   |19 |
-----------------------------------
|sa_family|dip|dport|sip|sport|res|
-----------------------------------
Bind Data (49)
-------------------------
|14       |15 |16   |17 |
-------------------------
|sa_family|sip|sport|res|
-------------------------
Execve Data (59)
-----------------------------------------------------------------------------------------------------
|14  |15      |16   |17    |18 |19   |20 |21   |22       |23      |24 |25        |26 |27        |28 |
-----------------------------------------------------------------------------------------------------
|argv|run_path|stdin|stdout|dip|dport|sip|sport|sa_family|pid_tree|tty|socket_pid|ssh|ld_preload|res|
-----------------------------------------------------------------------------------------------------
Note:
-
socket_exe/dip/dport/sip/sport/sa_family is collected from the process's fds
-
ssh/ld_preload is collected from the process's env
Process Exit Data (60)
Only contains fields in Common Data
Kill Data (62)
----------------
|14        |15 |
----------------
|target_pid|sig|
----------------
Rename Data (82)
-------------------------
|14      |15      |16   |
-------------------------
|old_name|new_name|sb_id|
-------------------------
Link Data (86)
-------------------------
|14      |15      |16   |
-------------------------
|old_name|new_name|sb_id|
-------------------------
Ptrace Data (101)
----------------------------------------------
|14            |15        |16  |17  |18      |
----------------------------------------------
|ptrace_request|target_pid|addr|data|pid_tree|
----------------------------------------------
Setsid Data (112)
Only contains fields in Common Data
Prctl Data (157)
_________________
|14    |15      |
-----------------
|option|new_name|
-----------------
Mount Data (165)
_____________________________________
|14      |15 |16       |17    |18   |
-------------------------------------
|pid_tree|dev|file_path|fstype|flags|
-------------------------------------
Tkill data (200)
----------------
|14        |15 |
----------------
|target_pid|sig|
----------------
Exit Group Data (231)
Only contains fields in Common Data
Memfd Create Data (356)
______________
|14    |15   |
--------------
|fdname|flags|
--------------
Dns Query Data (601)
--------------------------------------------------
|14   |15       |16 |17   |18 |19   |20    |21   |
--------------------------------------------------
|query|sa_family|dip|dport|sip|sport|opcode|rcode|
--------------------------------------------------
Create File data (602)
----------------------------------------------------------
|14 	  |15 |16   |17 |18   |19       |20        |21   |
----------------------------------------------------------
|file_path|dip|dport|sip|sport|sa_family|socket_pid|sb_id|
----------------------------------------------------------
Load Module Data (603)
---------------------------
|14      |15      |16     |
---------------------------
|ko_file|pid_tree|run_path|
---------------------------
Update Cred Data (604)
----------------------
|14      |15     |16 |
----------------------
|pid_tree|old_uid|res|
----------------------
Unlink Data (605)
------
|14  |
------
|file|
------
Rmdir Data (606)
------
|14  |
------
|file|
------
call_usermodehelper_exec Data (607)
-------------------------
|1        |2  |3   |4   |
-------------------------
|data_type|exe|argv|wait|
-------------------------
File Write Data (608)
------------
|14  |15   |
------------
|file|sb_id|
------------
Need to join the to-watch list through Diver Filter, see "About Driver Filter" section for details
File Read Data (609)
------------
|14  |15   |
------------
|file|sb_id|
------------
Need to join the to-watch list through Diver Filter, see "About Driver Filter" section for details
USB Device Event Data (610)
-----------------------------------------
|14          |15          |16    |17    |
-----------------------------------------
|product_info|manufacturer|serial|action|
-----------------------------------------
action = 1 is USB_DEVICE_ADD
action = 2 is USB_DEVICE_REMOVE
Privilege Escalation (611)
------------------------------
|14   |15      |16    |17    |
------------------------------
|p_pid|pid_tree|p_cred|c_cred|
------------------------------
p_cred = uid|euid|suid|fsuid|gid|egid|sgid|fsgid
c_cred = uid|euid|suid|fsuid|gid|egid|sgid|fsgid
Port-scan attack detection (612)
------------------------------------------
|1   |2        |3  |4    |5  |6    |7    |
------------------------------------------
|type|sa_family|sip|sport|dip|dport|flags|
------------------------------------------
Proc File Hook (700)
-----------------------
|1        |2          |
-----------------------
|data_type|module_name|
-----------------------
Syscall Table Hook Data (701)
--------------------------------------
|1        |2          |3             |
--------------------------------------
|data_type|module_name|syscall_number|
--------------------------------------
Hidden Kernel Module Data (702)
-----------------------
|1        |2          |
-----------------------
|data_type|module_name|
-----------------------
Interrupt Table Hook Data (703)
----------------------------------------
|1        |2          |3               |
----------------------------------------
|data_type|module_name|interrupt_number|
----------------------------------------
About Driver Filter
Elkeid driver supports allowlist to filter out unwanted data. We provide two types of allowlists, 'exe' allowlist and 'argv' allowlist. 'exe' allowlist acts on execve/create file/dns query/connect hooks, while 'argv' allowlist only acts on execve hook. For performance and stability concerns, both 'exe' and 'argv' allowlist only supports 64-elements-wide capacity.
allowlist driver is in: /dev/hids_driver_allowlist
| Operations | Flag | Example |
|---|---|---|
| ADD_EXECVE_EXE_SHITELIST | Y(89) | echo Y/bin/ls > /dev/someone_allowlist |
| DEL_EXECVE_EXE_SHITELIST | F(70) | echo F/bin/ls > /dev/someone_allowlist |
| DEL_ALL_EXECVE_EXE_SHITELIST | w(119) | echo w/del_all > /dev/someone_allowlist |
| EXECVE_EXE_CHECK | y(121) | echo y/bin/ls > /dev/someone_allowlist && dmesg |
| ADD_EXECVE_ARGV_SHITELIST | m(109) | echo m/bin/ls -l > /dev/someone_allowlist |
| DEL_EXECVE_ARGV_SHITELIST | J(74) | echo J/bin/ls -l > /dev/someone_allowlist |
| DEL_ALL_EXECVE_ARGV_SHITELIST | u(117) | echo u/del_all > /dev/someone_allowlist |
| EXECVE_ARGV_CHECK | z(122) | echo z/bin/ls -l > /dev/someone_allowlist && dmesg |
| PRINT_ALL_ALLOWLIST | .(46) | echo ./print_all > /dev/someone_allowlist && dmesg |
| ADD_WRITE_NOTIFI | W(87) | echo W/etc/passwd > /dev/someone_allowlist or echo W/etc/ssh/ > /dev/someone_allowlist support dir |
| DEL_WRITE_NOTIFI | v(120) | echo v/etc/passwd > /dev/someone_allowlist |
| ADD_READ_NOTIFI | R(82) | echo R/etc/passwd > /dev/someone_allowlist or echo R/etc/ssh/ > /dev/someone_allowlist support dir |
| DEL_READ_NOTIFI | s(115) | echo s/etc/passwd > /dev/someone_allowlist |
| DEL_ALL_NOTIFI | A(65) | echo A/del_all_file_notift > /dev/someone_allowlist |
Filter define is:
#define ADD_EXECVE_EXE_SHITELIST 89         /* Y */
#define DEL_EXECVE_EXE_SHITELIST 70         /* F */
#define DEL_ALL_EXECVE_EXE_SHITELIST 119    /* w */
#define EXECVE_EXE_CHECK 121                /* y */
#define PRINT_ALL_ALLOWLIST 46              /* . */
#define ADD_EXECVE_ARGV_SHITELIST 109       /* m */
#define DEL_EXECVE_ARGV_SHITELIST 74        /* J */
#define DEL_ALL_EXECVE_ARGV_SHITELIST 117   /* u */
#define EXECVE_ARGV_CHECK 122               /* z */

#define ADD_WRITE_NOTIFI 87                 /* W */
#define DEL_WRITE_NOTIFI 120                /* v */
#define ADD_READ_NOTIFI 82                  /* R */
#define DEL_READ_NOTIFI 115                 /* s */
#define DEL_ALL_NOTIFI 65                   /* A */
Performance Stats of Elkeid Driver
Testing Environment(VM):
| CPU | Intel(R) Xeon(R) Platinum 8260 CPU @ 2.40GHz 8 Core |
|---|---|
| RAM | 16GB |
| OS/Kernel | Debian9 / Kernel Version 4.14 |
Testing Load:
| syscall | ltp |
|---|---|
| connect | ./runltp -f syscalls -s connect -t 5m |
| bind | ./runltp -f syscalls -s bind -t 5m |
| execve | ./runltp -f syscalls -s execve -t 5m |
| security_inode_create | ./runltp -f syscalls -s open -t 5m |
| ptrace | ./runltp -f syscalls -s ptrace -t 5m |
Key kprobe Handler Testing Result(90s)
| hook function name | Average Delay(us) | TP99(us) | TP95(us) | TP90(us) |
|---|---|---|---|---|
| connect_syscall_handler | 0.7454 | 3.5017 | 1.904 | 1.43 |
| connect_syscall_entry_handler | 0.0675 | 0.3 | 0.163 | 0.1149 |
| udp_recvmsg_handler | 9.1290 | 68.7043 | 18.5357 | 15.9528 |
| udp_recvmsg_entry_handler | 0.5882 | 7.5631 | 0.7811 | 0.3665 |
| bind_handler | 2.2558 | 10.0525 | 8.1996 | 7.041 |
| bind_entry_handler | 0.4704 | 1.0180 | 0.8234 | 0.6739 |
| execve_entry_handler | 6.9262 | 12.2824 | 9.437 | 8.638 |
| execve_handler | 15.2102 | 36.0903 | 25.9272 | 23.068 |
| security_inode_create_pre_handler | 1.5523 | 7.9454 | 5.5806 | 3.1441 |
| ptrace_pre_handler | 0.2039 | 0.4648 | 0.254 | 0.228 |
udp_recvmsg_handler will work only if the port is equal 53 or 5353
Original Testing Data: Benchmark Data
About Deploy
You can use DKMS or Pre-packaged ko file
- install driver:
insmod hids_driver.ko - remove driver: first you need kill userspace agent and
rmmod hids_driver.ko
Known Bugs
-
Hook point init failed: do_init_module
Some old version of Ubuntu / CentOS kernels may show the dmesg : do_init_module register_kprobe failed, returned -2. -
Description of Elkeid's Crash caused by fput in low version Kernel
License
Elkeid kernel module are distributed under the GNU GPLv2 license.
Elkeid RASP
Introduction
- Analyze the runtime used by the process.
- The following probes are supported for dynamic attach to process:
- CPython
- Golang
- JVM
- NodeJS
- PHP
- Compatible with Elkeid stack.
Install
- build manually: GUIDE
- CMake 3.17+
- GCC 8+
- MUSL toolcahin 1.2.2 (download via CDN: link)
- RUST toolchain 1.40+
- JDK 11+(for Java probe)
- Python2 + Python3 + pip + wheel + header files (for python probe)
- PHP header files
- make and install
git submodule update --recursive --init

make -j$(nproc) build \
    STATIC=TRUE \
    PY_PREBUILT=TRUE \
    CC=/opt/x86_64-linux-musl-1.2.2/bin/x86_64-linux-musl-gcc \
    CXX=/opt/x86_64-linux-musl-1.2.2/bin/x86_64-linux-musl-g++ \
    LD=/opt/x86_64-linux-musl-1.2.2/bin/x86_64-linux-musl-ld \
    CARGO_TARGET_X86_64_UNKNOWN_LINUX_MUSL_LINKER=/opt/x86_64-linux-musl-1.2.2/bin/x86_64-linux-musl-ld \
    GNU_CC=/opt/gcc-10.4.0/bin/gcc \
    GNU_CXX=/opt/gcc-10.4.0/bin/g++ \
    PHP_HEADERS=/path/to/php-headers \
    PYTHON2_INCLUDE=/path/to/include/python2.7 \
    PYTHON3_INCLUDE=/path/to/include/python3 \
    VERSION=0.0.0.1

sudo make install
- build with docker:
curl -fsSL https://lf3-static.bytednsdoc.com/obj/eden-cn/laahweh7uhwbps/php-headers.tar.gz | tar -xz -C rasp/php

docker run --rm -v $(pwd):/Elkeid \
    -v /tmp/cache/gradle:/root/.gradle \
    -v /tmp/cache/librasp:/Elkeid/rasp/librasp/target \
    -v /tmp/cache/rasp_server:/Elkeid/rasp/rasp_server/target \
    -v /tmp/cache/plugin:/Elkeid/rasp/plugin/target \
    -e MAKEFLAGS="-j$(nproc)" hackerl/rasp-toolchain \
    make -C /Elkeid/rasp build \
    STATIC=TRUE \
    PY_PREBUILT=TRUE \
    CC=/opt/x86_64-linux-musl-1.2.2/bin/x86_64-linux-musl-gcc \
    CXX=/opt/x86_64-linux-musl-1.2.2/bin/x86_64-linux-musl-g++ \
    LD=/opt/x86_64-linux-musl-1.2.2/bin/x86_64-linux-musl-ld \
    CARGO_TARGET_X86_64_UNKNOWN_LINUX_MUSL_LINKER=/opt/x86_64-linux-musl-1.2.2/bin/x86_64-linux-musl-ld \
    GNU_CC=/opt/gcc-10.4.0/bin/gcc GNU_CXX=/opt/gcc-10.4.0/bin/g++ \
    PHP_HEADERS=/Elkeid/rasp/php/php-headers \
    PYTHON2_INCLUDE=/usr/local/include/python2.7 \
    PYTHON3_INCLUDE=/usr/local/include/python3 \
    VERSION=0.0.0.1
Run
- for single process inject
sudo env RUST_LOG=<loglevel> /etc/elkeid/plugin/RASP/elkeid_rasp -p <pid>
- with Elkied Agent (multi target)
Documentation is being written.
License
Elkeid RASP are distributed under the Apache-2.0 license.
![]()
About Elkeid Agent
Agent provides basic capability support for components on the host, including data communication, resource monitoring, component version control, file transfer, and host basic information collection.
Agent itself does not provide security capabilities, and operates as a system service as a plugin base. The policies of various functional plugins are stored in the server-side configuration, and after the Agent receives the corresponding control instructions and configuration, it will open, close, and upgrade itself and the plugins.
Bi-stream gRPC is used for communication between Agent and Server, and mutual TLS verification is enabled based on self-signed certificates to ensure transport security. Among them, the flow of information in the direction of Agent -> Server is called data flow, and the flow of information in the direction of Server -> Agent is generally control flow, using different message types of protobuf. The Agent itself supports client-side service discovery, and also supports cross-Region level communication configuration. It realizes that an Agent package can be installed in multiple network isolation environments. Based on a TCP connection at the bottom layer, two data transmissions, Transfer and FileOp, are realized in the upper layer. The service supports the data reporting of the plugin itself and the interaction with the files in the Host.
Plugins, as security capability plugins, generally have a "parent-child" process relationship with the Agent. Using two pipes as the cross-process communication method, the plugins lib provides two plugin libraries for Go and Rust, which are responsible for encoding and sending plugin-side information. It is worth mentioning that after the plugin sends data, it will be encoded as Protobuf binary data. After the Agent receives it, there is no need to decode it twice, and then splices the Header feature data in the outer layer and transmits it directly to the server. Generally, the server does not need to Decoding is directly transmitted to the subsequent data stream, and decoding is performed when used, which reduces the additional performance overhead caused by multiple encoding and decoding in data transmission to a certain extent.
The Agent is implemented in Go. Under Linux, systemd is used as a guardian to control resource usage by cgroup restrictions. It supports aarch64 and x86-64 architectures. It is finally compiled and packaged as deb and rpm packages for distribution. The formats are in line with systemd, Debian, and RHEL specifications. , which can be directly provided to the corresponding software repository for subsequent version maintenance. In subsequent versions, Agent for Windows platform will be released.
Runtime Requirements
Most of the functions provided by Agent and Plugin need to run at the host level with root privileges. In containers with limited privileges, some functions may be abnormal.
Quick Start
Through the complete deployment of elkeidup, you can directly obtain the installation package for Debian/RHEL series distributions, and deploy according to the commands of the Elkeid Console - Installation Configuration page.
Compile from source
Dependency Requirements
Confirm related configuration
- Make sure that the three files
ca.crt,client.key, andclient.crtin thetransport/connectiondirectory are the same as the files with the same name in the Agent Center'sconfdirectory. - Make sure the parameters in the
transport/connection/product.gofile are properly configured:- If it is a manually deployed Server:
serviceDiscoveryHost["default"]needs to be assigned to the intranet listening address and port of the ServiceDiscovery service or its proxy, for example:serviceDiscoveryHost["default"] = "192.168.0.1: 8088"privateHost["default"]needs to be assigned to the intranet listening address and port of the AgentCenter service or its proxy, for example:privateHost["default"] = "192.168.0.1: 6751"- If there is a public network access point of the Server,
publicHost["default"]needs to be assigned to the external network listening address and port of the AgentCenter service or its proxy, for example:publicHost[ "default"]="203.0.113.1:6751"
- If the Server is deployed through elkeidup, the corresponding configuration can be found according to the
~/.elkeidup/elkeidup_config.yamlfile of the deployed Server host:- Find the IP of the Nginx service in the configuration file, the specific configuration item is
nginx.sshhost[0].host - Find the IP of the ServiceDiscovery service in the configuration file, the specific configuration item is
sd.sshhost[0].host serviceDiscoveryHost["default"]needs to be assigned the IP of the ServiceDiscovery service and set the port number to 8088, for example:serviceDiscoveryHost["default"] = "192.168.0.1 :8088"privateHost["default"]needs to be assigned the IP of the Nginx service, and set the port number to 8090, for example:privateHost["default"] = "192.168.0.1:8090"
- Find the IP of the Nginx service in the configuration file, the specific configuration item is
- If it is a manually deployed Server:
Compile
Chage to the root directory of agent source code, execute:
BUILD_VERSION=1.7.0.24 bash build.sh
During the compilation process, the script will read the BUILD_VERSION environment variable to set the version information, which can be modified according to actual needs.
After the compilation is successful, in the output directory of the root directory, you should see 2 deb and 2 rpm files, which correspond to different systems and architectures.
Version Upgrade
- If no client component has been created, please create a new component in the Elkeid Console-Component Management page.
- On the Elkeid Console - Component Management page, find the "elkeid-agent" entry, click "Release Version" on the right, fill in the version information and upload the files corresponding to the platform and architecture, and click OK.
- On the Elkeid Console - Component Policy page, delete the old "elkeid-agent" version policy (if any), click "New Policy", select the version just released, and click OK. Subsequent newly installed Agents will be self-upgraded to the latest version.
- On the Elkeid Console - Task Management page, click "New Task", select all hosts, click Next, select the "Sync Configuration" task type, and click OK. Then, find the task you just created on this page, and click Run to upgrade the old version of the Agent.
License
Elkeid Agent is distributed under the Apache-2.0 license.
Baseline
The baseline plugin detects assets through existing or custom baseline policies to determine whether the baseline security configuration is risky. The baseline plugin scans regularly once a day, and can also be executed immediately through the front end.
Platform compatibility
- centos 6,7,8
- debian 8,9,10
- ubuntu 14.04-20.04
(The rest of the versions and distributions are theoretically compatible)
Build environment required
- Go >= 1.18
Building
rm -rf output
mkdir output
# x86_64
go build -o baseline main.go
tar -zcvf baseline-linux-x86_64.tar.gz baseline config
mv baseline-linux-x86_64.tar.gz output/
# arch64
GOARCH=arm64 go build -o baseline main.go
tar -zcvf baseline-linux-x86_64.tar.gz baseline config
mv baseline-linux-x86_64.tar.gz output/
After the compilation is successful, you should see two plg files in the output directory of the root directory, which correspond to different system architectures.
Version Upgrade
- If no client component has been created, please create a new component in the Elkeid Console-Component Management page.
- On the Elkeid Console - Component Management page, find the "collector" entry, click "Release Version" on the right, fill in the version information and upload the files corresponding to the platform and architecture, and click OK.
- On the Elkeid Console - Component Policy page, delete the old "collector" version policy (if any), click "New Policy", select the version just released, and click OK. Subsequent newly installed Agents will be self-upgraded to the latest version.
- On the Elkeid Console - Task Management page, click "New Task", select all hosts, click Next, select the "Sync Configuration" task type, and click OK. Then, find the task you just created on this page, and click Run to upgrade the old version of the Agent.
Baseline configuration
General configuration
The rules of the baseline plugin are configured through yaml files, which mainly include the following fields (it is recommended to refer to the actual configuration under the config file):
check_id:
type:
title:
description:
solution:
security:
type_cn:
title_cn:
description_cn:
solution_cn:
check:
    rules:
    - type: "file_line_check"
        param:
        - "/etc/login.defs"
        filter: '\s*\t*PASS_MAX_DAYS\s*\t*(\d+)'
        result: '$(<=)90'
Custom rules
The "check.rules" field in each check item configuration is the matching rule, and each field is explained below:
rules.type
Checking type, the built-in detection rules currently adapted by the baseline plugin (src/check/rules.go) include:
| Checking rule | Meaning | Parameters | Return value |
| ---- | ---- | ---- | ---- |
| command_check | Check commands to be executed | 1:Command
2:Special parameter(e.g. ignore_exit suggests the check is passed with commands errors) | Command result
| file_line_check | Traverse file and check by line | 1:File absolute path
2:Flag(For quick filtering lines, reducing the pressure of regular matching)
3:File comments(default:#) | true/false/Regex match value
| file_permission | Check whether file permissions meet the security configuration | 1: File absolute path
2: File minimum permissions(octal based,e.g. 644) | true/false
| if_file_exist | Check whether file exists | 1: File absolute path | true/false
| file_user_group | Check file user group | 1: File absolute path
2: User group id | true/false
| file_md5_check | Check whether file MD5 is consistent | 1: File absolute path
2: MD5 | true/false
| func_check | Check through special rules | 1:The function | true/false
rules.param
Array of rule parameters
rules.require
Rule Prerequisites: Some security baseline configurations may have detection prerequisites, and security risks will only exist if the prerequisites are met, such as:
rules:
  - type: "file_line_check"
    require: "allow_ssh_passwd"
    param:
        - "/etc/ssh/sshd_config"
    filter: '^\s*MaxAuthTries\s*\t*(\d+)'
    result: '$(<)5'
allow_ssh_passwd: Allow users to login through ssh passwords.
rules.result
Checking result,support int,string,bool, $() suggests special checking syntax, e.g.: | Checking syntax | Description | Example | Example description | | ---- | ---- | ---- | ---- | | $(&&) | AND | ok$(&&)success| The result is "ok" or "success" | | $(<=) | Common operators | $(<=)4| Result<=4 | | $(not) | INVERT | $(not)error| The result is not "error" |
Complex example:
$(<)8$(&&)$(not)2 : Result<8 and result is not 2
check.condition
Since there may be multiple rules for a rule, the relationship between the rule can be defined through the condition field.
all: Check passed if all the rules are matched.
any: Check passed if any of the rules is matched.
none: Check passed if none of the rules is matched.
Submit a task
Task issued
{
    "baseline_id": 1200,
    "check_id_list":[1,2,3]
}
Result return
{
    "baseline_id": 1200,
    "status": "success",
    "msg": "",
    "check_list":[
        "check_id": 1,
        "type": "",
        "title": "",
        "description": "",
        "solution": "",
        "type_cn": "",
        "title_cn": "",
        "description_cn": "",
        "solution_cn": "",
        "result": "",
        "msg": "",
    ]
}
Result:
SuccessCode 		= 1
FailCode 		= 2
ErrorCode 		= -1
ErrorConfigWrite	= -2
ErrorFile		= -3
![]()
About collector Plugin
The collector periodically collects various asset information on the host and performs correlation analysis. Currently, the following asset types are supported:
- Process: supports the hash calculation of exe md5, which can be associated with threat intelligence analysis, and also associated with container information to support subsequent data traceability. (avaliable in container)
- Port: Support information extraction of tcp and udp listening ports, as well as associated reporting with process and container information. In addition, based on the sock status and its relationship, it analyzes externally exposed services and supports the analysis function of host exposed surfaces. (avaliable in container)
- Account: In addition to the basic account fields, weak passwords are detected on the terminal based on the weak password dictionary based on the hash collision, and the weak password baseline detection function of the Console is provided upwards. In addition, the sudoers configuration will be correlated and reported together.
- Software: Support system software packages, pypi packages, jar packages, and upwardly support the vulnerability scanning function. (partially avaliable in container)
- Container: Support container information collection under multiple runtimes such as docker and cri/containerd.
- Application: Support database, message queue, container component, Web service, DevOps tools and other types of application collection, currently supports the matching and extraction of 30+ common application versions, configuration files. (avaliable in container)
- Hardware: Supports the collection of hardware information such as network cards and disks.
- System integrity verification: By comparing the hash of the software package file with the actual file hash of the Host, it is judged whether the file has been changed.
- Kernel module: Collect basic fields, as well as additional fields such as memory addresses and dependencies.
- System services, scheduled tasks: Compatible with the definition of services and cron locations under different distributions, and parse the core fields.
Runtime requirements
Supports mainstream Linux distributions, including CentOS, RHEL, Debian, Ubuntu, RockyLinux, OpenSUSE, etc. Supports x86-64 and aarch64 architectures.
Quick start
Through the complete deployment of elkeidup, this plugin is enabled by default.
Compile from source
Dependency requirements
- Go >= 1.18
Compile
In the root directory, execute:
BUILD_VERSION=1.7.0.140 bash build.sh
During the compilation process, the script will read the BUILD_VERSION environment variable to set the version information, which can be modified according to actual needs.
After the compilation is successful, you should see two plg files in the output directory of the root directory, which correspond to different system architectures.
Version Upgrade
- If no client component has been created, please create a new component in the Elkeid Console-Component Management page.
- On the Elkeid Console - Component Management page, find the "collector" entry, click "Release Version" on the right, fill in the version information and upload the files corresponding to the platform and architecture, and click OK.
- On the Elkeid Console - Component Policy page, delete the old "collector" version policy (if any), click "New Policy", select the version just released, and click OK. Subsequent newly installed Agents will be self-upgraded to the latest version.
- On the Elkeid Console - Task Management page, click "New Task", select all hosts, click Next, select the "Sync Configuration" task type, and click OK. Then, find the task you just created on this page, and click Run to upgrade the old version of the Agent.
License
collector is distributed under the Apache-2.0 license.
About driver Plugin
The Driver plugin manages Kernel Module, supplements and filters data, and finally generates different system events to support related alarm functions.
Runtime requirements
Supports mainstream Linux distributions, including CentOS, RHEL, Debian, Ubuntu, RockyLinux, OpenSUSE, etc. Supports x86-64 and aarch64 architectures.
The kernel version of the host needs to be in the supported list, if not, it needs to be compiled and uploaded separately, see Description for details.
Quick start
Through the complete deployment of elkeidup, this plugin is enabled by default.
Compile from source
Dependency requirements
Confirm related configuration
- It is necessary to ensure that the
DOWNLOAD_HOSTSvariable insrc/config.rshas been configured as the actual deployed Nginx service address:- If it is a manually deployed Server: you need to ensure that it is configured as the address of the Nginx file service, for example:
pub const DOWNLOAD_HOSTS: &'static [&'static str] = &["http://192.168.0.1:8080" ]; - If the Server is deployed through elkeidup, the corresponding configuration can be obtained according to the
~/.elkeidup/elkeidup_config.yamlfile of the deployed Server host, and the specific configuration item isnginx .sshhost[0].host, then set the port number to 8080, for example:pub const DOWNLOAD_HOSTS: &'static [&'static str] = &["http://192.168.0.1:8080"];
- If it is a manually deployed Server: you need to ensure that it is configured as the address of the Nginx file service, for example:
Compile
In the root directory, execute:
BUILD_VERSION=1.0.0.15 bash build.sh
During the compilation process, the script will read the BUILD_VERSION environment variable to set the version information, which can be modified according to actual needs.
After the compilation is successful, you should see two plg files in the output directory of the root directory, which correspond to different system architectures.
Version Upgrade
- If no client component has been created, please create a new component in the Elkeid Console-Component Management page.
- On the Elkeid Console - Component Management page, find the "collector" entry, click "Release Version" on the right, fill in the version information and upload the files corresponding to the platform and architecture, and click OK.
- On the Elkeid Console - Component Policy page, delete the old "collector" version policy (if any), click "New Policy", select the version just released, and click OK. Subsequent newly installed Agents will be self-upgraded to the latest version.
- On the Elkeid Console - Task Management page, click "New Task", select all hosts, click Next, select the "Sync Configuration" task type, and click OK. Then, find the task you just created on this page, and click Run to upgrade the old version of the Agent.
License
driver plugin is distributed under the Apache-2.0 license.
About journal_watcher Plugin
The journal_watcher plugin reads and parses sshd logs to generate sshd login and gssapi events.
Runtime requirements
Supports mainstream Linux distributions, including CentOS, RHEL, Debian, Ubuntu, RockyLinux, OpenSUSE, etc. Supports x86-64 and aarch64 architectures.
Quick start
Through the complete deployment of elkeidup, this plugin is enabled by default.
Compile from source
Dependency requirements
Compile
In the root directory, execute:
BUILD_VERSION=1.7.0.23 bash build.sh
During the compilation process, the script will read the BUILD_VERSION environment variable to set the version information, which can be modified according to actual needs.
After the compilation is successful, you should see two plg files in the output directory of the root directory, which correspond to different system architectures.
Version Upgrade
- If no client component has been created, please create a new component in the Elkeid Console-Component Management page.
- On the Elkeid Console - Component Management page, find the "collector" entry, click "Release Version" on the right, fill in the version information and upload the files corresponding to the platform and architecture, and click OK.
- On the Elkeid Console - Component Policy page, delete the old "collector" version policy (if any), click "New Policy", select the version just released, and click OK. Subsequent newly installed Agents will be self-upgraded to the latest version.
- On the Elkeid Console - Task Management page, click "New Task", select all hosts, click Next, select the "Sync Configuration" task type, and click OK. Then, find the task you just created on this page, and click Run to upgrade the old version of the Agent.
License
journal_watcher is distributed under the Apache-2.0 license.
-
- 2.1. Docker Builder
- 2.2. Compile
-
- 3.1. [Scan Path config](#ScanPathconfig.srcconfig.rs)
- 3.2. [Engine config](#Engineconfig.srcmodelengineclamavconfig.rs)
- 3.3. [Option : 1. Clamav database Database config.](#Option:1.ClamavdatabaseDatabaseconfig.srcmodelengineclamavupdater.rs.)
- 3.4. Option : 2. Rules
Elkeid-Scanner
1. About Scanner Plugin
Current Version: 1.9.X
Scanner is a Elkied plugin for scanning static files (using clamav engine).
1.1. Supported Platforms
Same as Elkeid Agent. Pre-Compiled binary support : x86_64, Aarch64
1.2. Agent/DataFlow compatibility
forward compatible: 1.7.X、1.8.X
2. Build
Scanner CI workflow seen Github Action.
2.1. Docker Builder
- aarch64
- Dockerfile.aarch64
- CI.aarch64
- aarch64 scanner Binary
{ "id_list":[ "xxxxxxxx" ], "data":{ "config":[ { "name":"scanner", "version":"3.1.9.6", "download_url":[ "http://lf3-elkeid.bytetos.com/obj/elkeid-download/plugin/scanner/scanner-default-aarch64-3.1.9.6.tar.gz", "http://lf6-elkeid.bytetos.com/obj/elkeid-download/plugin/scanner/scanner-default-aarch64-3.1.9.6.tar.gz", "http://lf9-elkeid.bytetos.com/obj/elkeid-download/plugin/scanner/scanner-default-aarch64-3.1.9.6.tar.gz", "http://lf26-elkeid.bytetos.com/obj/elkeid-download/plugin/scanner/scanner-default-aarch64-3.1.9.6.tar.gz" ], "type": "tar.gz", "sha256": "d75a5c542a2d7c0900ad96401d65833833232fcf539896ac2d2a95619448850b", "signature": "1089b8fdcb69eac690323b0d092d8386901ded2155a057bf4d044679a2b83a9c", "detail":"" } ] } } - x86_64
- Dockerfile.x86_64
- CI.x86_64
- x86_64 scanner Binary
{
    "id_list":[
        "xxxxxxxx"
    ],
    "data":{
        "config":[
            {
                "name":"scanner",
                "version":"3.1.9.6",
                "download_url":[
                    "http://lf3-elkeid.bytetos.com/obj/elkeid-download/plugin/scanner/scanner-default-x86_64-3.1.9.6.tar.gz",
                    "http://lf6-elkeid.bytetos.com/obj/elkeid-download/plugin/scanner/scanner-default-x86_64-3.1.9.6.tar.gz",
                    "http://lf9-elkeid.bytetos.com/obj/elkeid-download/plugin/scanner/scanner-default-x86_64-3.1.9.6.tar.gz",
                    "http://lf26-elkeid.bytetos.com/obj/elkeid-download/plugin/scanner/scanner-default-x86_64-3.1.9.6.tar.gz"
                ],
                "type": "tar.gz",
                "sha256": "e17e7380233c64172c767aa7587a9e303b11132e97c0d36a42e450469c852fdf",
                "signature": "527c6ea0caac3b0604021de5aa2d34e4b9fae715e5e6cdd37e8f485869f923c2",
                "detail":""
            }
        ]
    }
}
2.2. Compile
# x86_64
docker build -t scanner -f docker/Dockerfile.x86_64 ../../
docker create --name scanner scanner
docker cp scanner:/Elkeid/plugins/scanner/output/scanner-x86_64.tar.gz ./
docker rm -f scanner

# aarch64
docker build -t scanner -f docker/Dockerfile.aarch64 ../../
docker create --name scanner scanner
docker cp scanner:/Elkeid/plugins/scanner/output/scanner-aarch64.tar.gz ./
docker rm -f scanner
3. Config
There are following files, with some constants. In order to avoid occupying too much system resources, it is recommended to use the default parameters.
- Scan Path config src/config.rs
- Engine config src/model/engine/clamav/config.rs
- Database config src/model/engine/clamav/updater.rs
3.1. Scan Path config
SCAN_DIR_CONFIGdefine the scan directory list and recursion depthSCAN_DIR_FILTERdefine the filter directory list matched by prefix
3.2. Engine config
CLAMAV_MAX_FILESIZEdefine the maximum file size of scanned files (skip large files)
3.3. Option : 1. Clamav database Database config.
Get default database url with default password clamav_default_passwd:
wget http://lf26-elkeid.bytetos.com/obj/elkeid-download/18249e0cbe7c6aca231f047cb31d753fa4604434fcb79f484ea477f6009303c3/archive_db_default_20220817.zip

#wget http://lf3-elkeid.bytetos.com/obj/elkeid-download/18249e0cbe7c6aca231f047cb31d753fa4604434fcb79f484ea477f6009303c3/archive_db_default_20220817.zip

#wget http://lf6-elkeid.bytetos.com/obj/elkeid-download/18249e0cbe7c6aca231f047cb31d753fa4604434fcb79f484ea477f6009303c3/archive_db_default_20220817.zip

#wget http://lf9-elkeid.bytetos.com/obj/elkeid-download/18249e0cbe7c6aca231f047cb31d753fa4604434fcb79f484ea477f6009303c3/archive_db_default_20220817.zip
The clamav scanner plugin will load local database from TMP_PATH/archive_db_default.zip with password ARCHIVE_DB_PWD, besides, it will also check ARCHIVE_DB_VERSION from ARCHIVE_DB_VERSION_FILE and ARCHIVE_DB_PWD.
More details in src/model/engine/updater.rs
3.4. Option : 2. Rules
The default database includes cropped clamav database and open source yara rules.
root@hostname$ ls
main.ldb  main.ndb  online_XXXXXXXX.yar
More details in Clamav Docs
- Notice
- There are currently a few limitations on using YARA rules within ClamAV
4. plugin task
scanner plugin task (Seen Elkeid Console Doc):
- Dir scan
- Fulldisk scan
- Quick scan
5. Scanner Report DataType
| DataType | 6000-ScanTaskFinished | description |
|---|---|---|
| 1 | status | task status : failed,succeed |
| 2 | msg | log |
| DataType | 6001-StaticMalwareFound | description |
|---|---|---|
| 1 | types | FileType |
| 2 | class | MalwareClass |
| 3 | name | MalwareName |
| 4 | exe | target file path |
| 5 | static_file | target file path |
| 6 | exe_size | target file size |
| 7 | exe_hash | target file 32kb xxhash |
| 8 | md5_hash | target file md5 hash |
| 9 | create_at | target file birth time |
| 10 | modify_at | target file last modify time |
| 11 | hit_data | yara hit data(if yara hit) |
| 12 | token | task token (only in 6057 task report) |
| DataType | 6002-ProcessMalwareFound | description |
|---|---|---|
| 1 | types | FileType |
| 2 | class | MalwareClass |
| 3 | name | MalwareName |
| 4 | exe | exe file path |
| 5 | static_file | exe file path |
| 6 | exe_size | exe file size |
| 7 | exe_hash | exe 32kb xxhash |
| 8 | md5_hash | exe md5 hash |
| 9 | create_at | exe birth time |
| 10 | modify_at | exe last modify time |
| 11 | hit_data | yara hit data(if yara hit) |
| 12 | pid | process id |
| 13 | ppid | parent process id |
| 14 | pgid | process group id |
| 15 | tgid | thread group id |
| 16 | argv | exe cmdline |
| 17 | comm | process comm name |
| 18 | sessionid | proc/pid/stat/sessionid |
| 19 | uid | use ID |
| 20 | pns | process namespace |
| 21 | token | task token (only in 6057 task report) |
| DataType | 6003-PathScanTaskResult | description |
|---|---|---|
| 1 | types | target FileType |
| 2 | class | MalwareClass |
| 3 | name | MalwareName |
| 4 | exe | target file path |
| 5 | static_file | target file path |
| 6 | exe_size | target file size |
| 7 | exe_hash | target file 32kb xxhash |
| 8 | md5_hash | target file md5 hash |
| 9 | create_at | target file birth time |
| 10 | modify_at | target file last modify time |
| 11 | hit_data | yara hit data(if yara hit) |
| 12 | token | task token |
| 13 | error | error log |
6. Known Errors & issues
- Creation time / birth_time is not available for some filesystems
error: "creation time is not available for the filesystem
- Centos7 default compile tool-chains didn't work, high version of tool-chains needed.
7. License
Clamav Scanner Plugin is distributed under the GPLv2 license.
Elkeid HUB
Elkeid HUB is a rule/event processing engine maintained by the Elkeid Team that supports streaming/offline (not yet supported by the community edition) data processing. The original intention is to solve complex data/event processing and external system linkage requirements through standardized rules.
Core Components
INPUTdata input layer, community edition only supports Kafka.RULEENGINE/RULESETcore components for data detection/external data linkage/data processing.OUTPUTdata output layer, community edition only supports Kafka/ES.SMITH_DSLused to describe the data flow relationship.
Application Scenarios
-
Simple HIDS
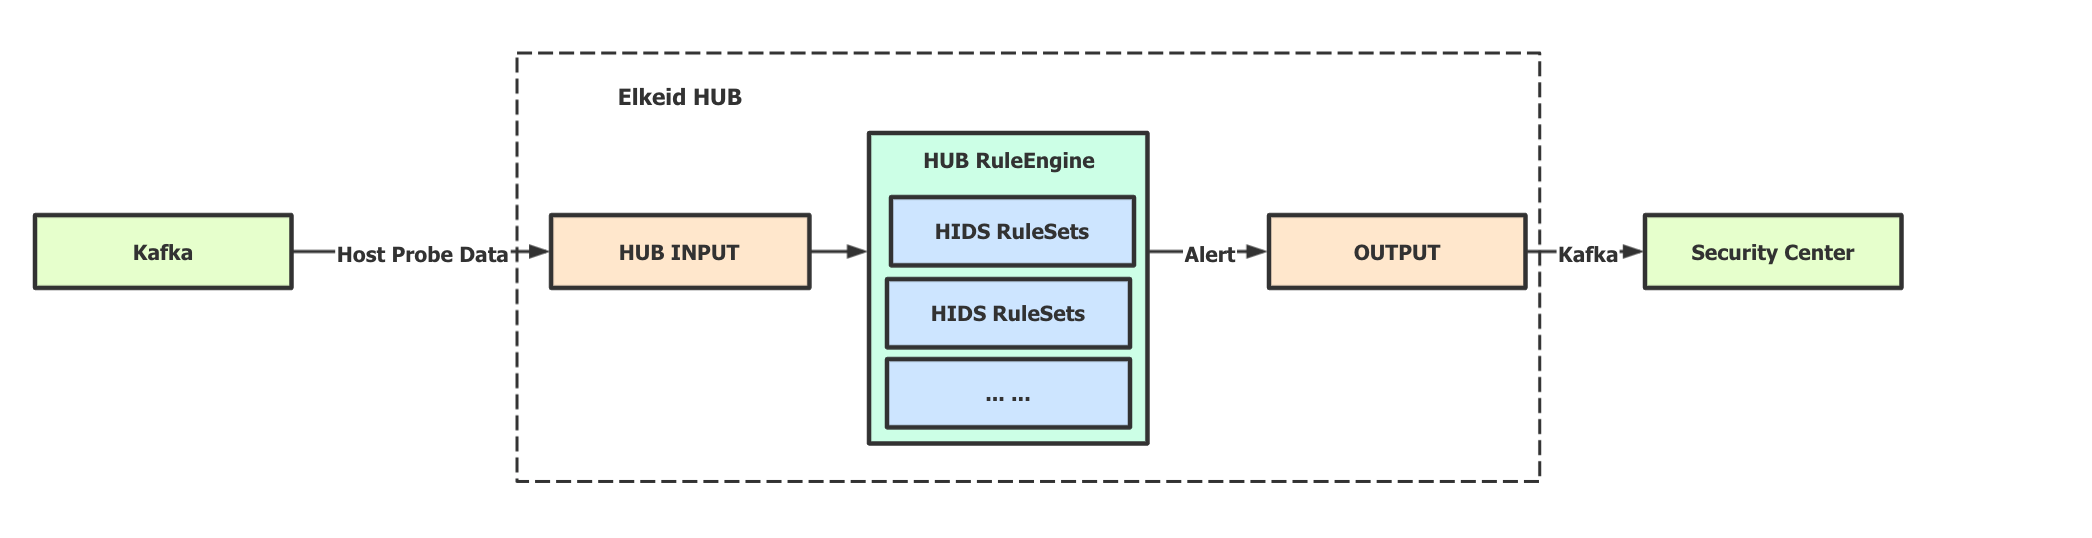
-
IDS Like Scenarios
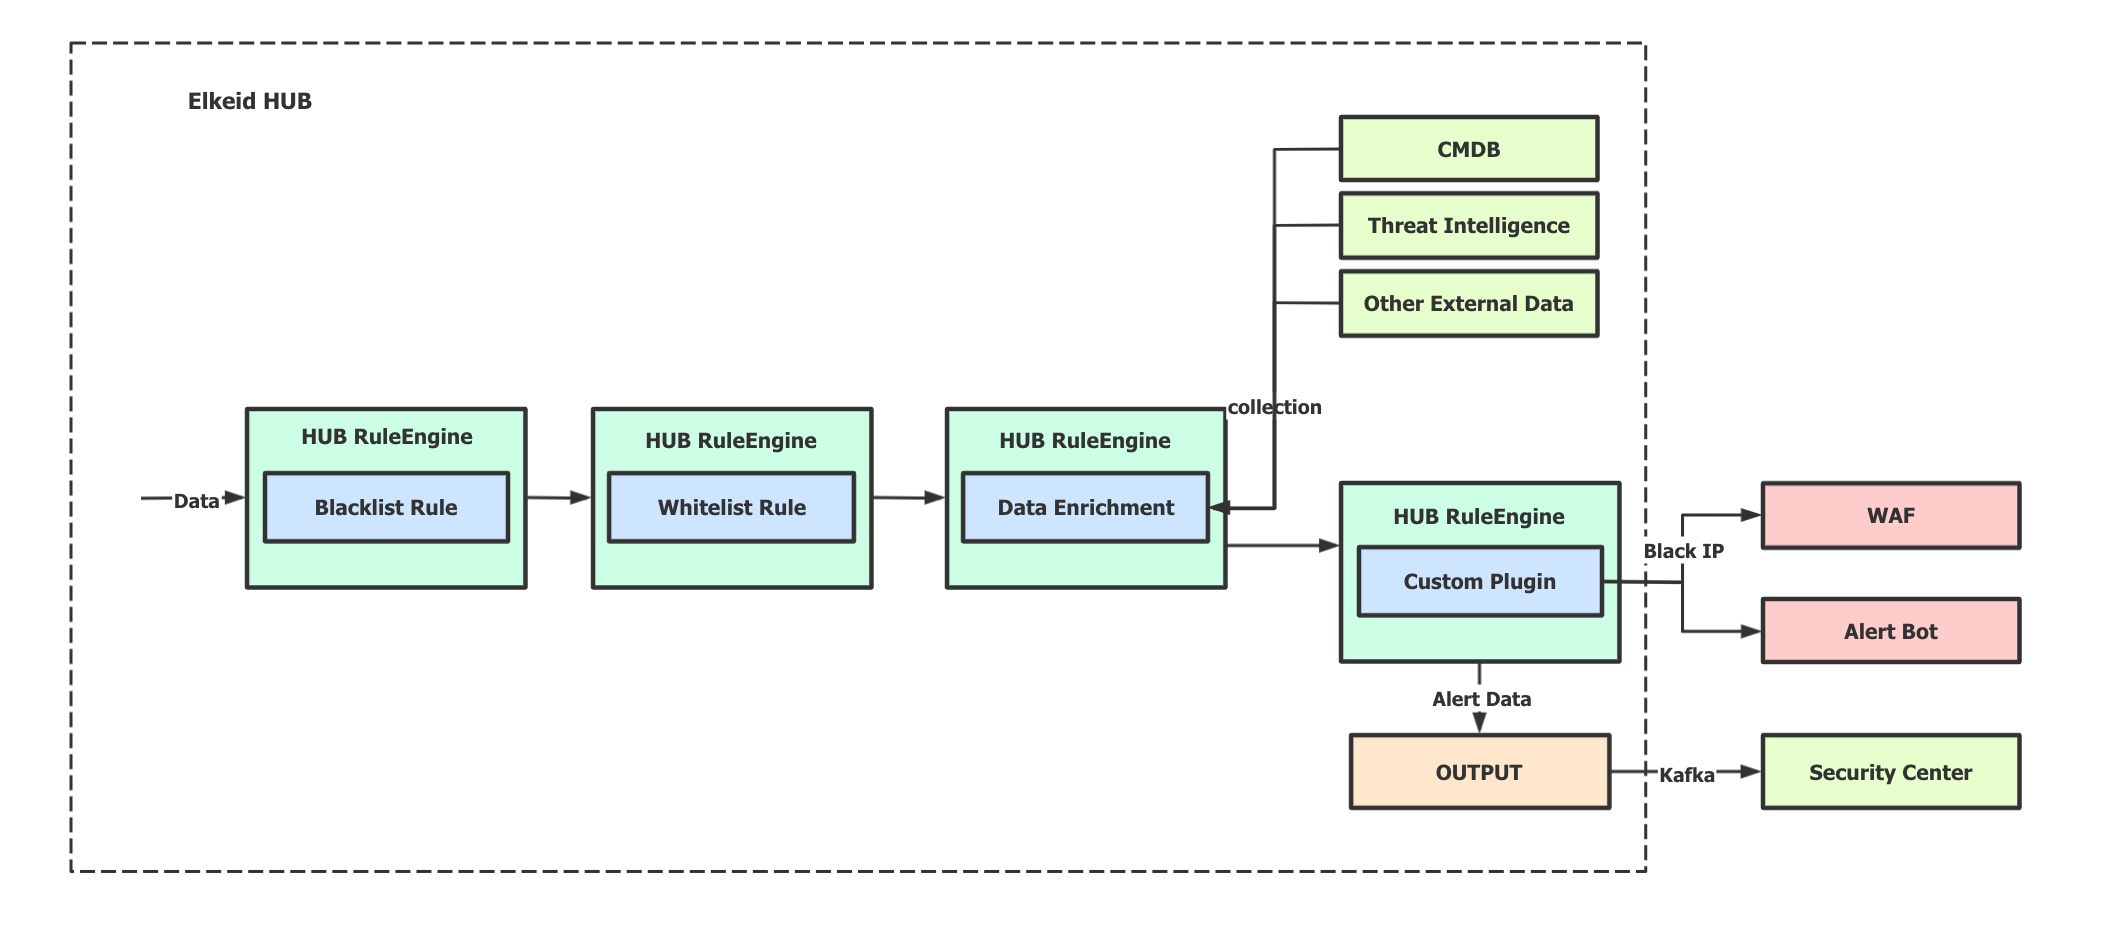
-
Multiple input and output scenarios
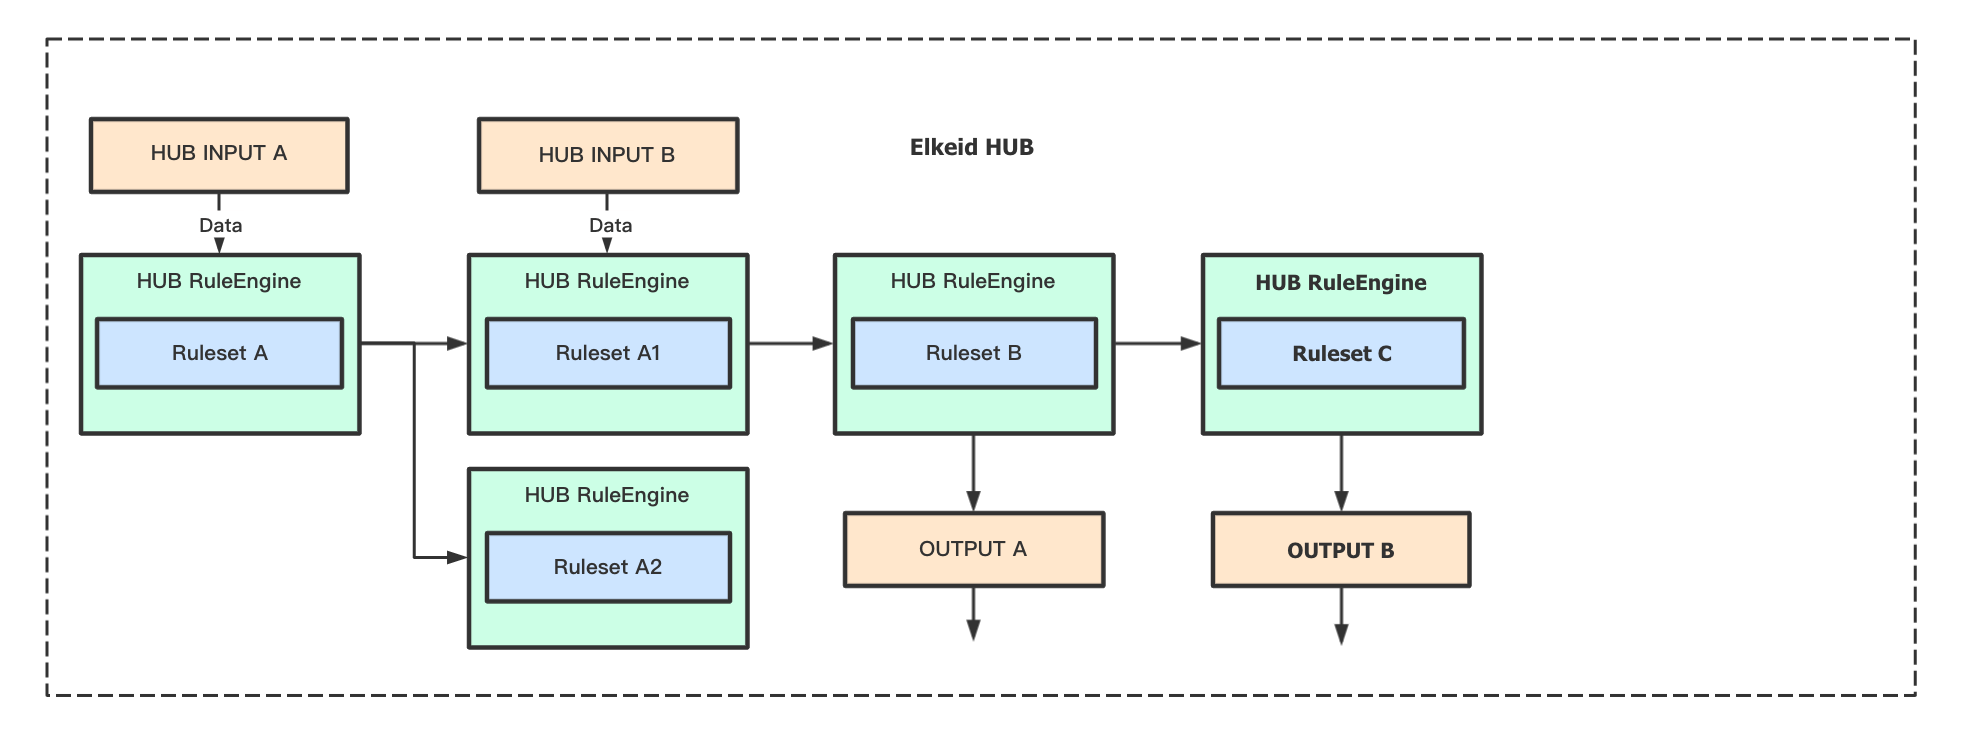
Advantage
- High Performance
- Very Few Dependencies
- Support Complex Data Processing
- Custom Plugin Support
- Support Stateful Logic Build
- Support External System/Data Linkage
Elkeid Internal Best Practices
- Use Elkeid HUB to process Elkeid HIDS/RASP/Sandbox/K8s auditing etc. raw data, TPS 120+ million/s. HUB scheduling instance 6000+
- 99% alarm produce time is less than 0.5s
- Internal Maintenance Rules 2000+
Elkeid-HUB Function List
| Ability List | Elkeid Community Edition | Elkeid Enterprise Edition |
|---|---|---|
| Streaming data processing | :white_check_mark: | :white_check_mark: |
| Data input, output capability | :white_check_mark: | :white_check_mark: |
| Full frontend support | :white_check_mark: | :white_check_mark: |
| Monitoring capability | :white_check_mark: | :white_check_mark: |
| Plugin support | :white_check_mark: | :white_check_mark: |
| Debug support | :white_check_mark: | :white_check_mark: |
| Offline data processing | :ng_man: | :white_check_mark: |
| Data Persistence capability | :ng_man: | :white_check_mark: |
| Workspace | :ng_man: | :white_check_mark: |
| Cluster mode | :ng_man: | :white_check_mark: |
| Online upgrade strategy | :ng_man: | :white_check_mark: |
Front-end Display (Community Edition)
Overview

Edit Rule

Edit HUB Project

Edit HUB Python Plugin

Submission Rules

Getting Started
Elkeid HUB Handbook (Chinese Version Only)
Demo Config
Elkeid HIDS Rule and Project (Just Example)
(Need to use with Elkeid)
LICENSE (Not Business Friendly)
Contact us && Cooperation

Elkeid HUB Community Edition User Guide
Applicable version
Elkeid HUB Elkeid Community Edition
1 Overview
Elkeid Hub is a product born to address the needs of data reporting - real-time stream processing and event processing in real-time processing in various fields, suitable for scenarios such as intrusion detection/event processing and orchestration and so on.

2 Elkeid HUB Advantages
- High performance. 10 times compare to Flink, and supports distributed horizontal expansion.
- Policies writing is simplified. security operators only need to focus on data processing itself and the learning cost is very low.
- Support custom plugins. Support plugins to better handle complex requirements.
- Easy deployment. Written in go, standalone and limited dependency.
3 Elkeid HUB Component Overview
Elkeid HUB components are mainly divided into the following categories:
- Input: Data is consumed through the Input component and entered into Elkeid HUB, currently supporting Kafka Kafka.
- Output: Data pushes the data flowing in the Elkeid HUB out of the HUB through the Output component, which currently supports ES /Kafka.
- RuleSet: The core logic of data processing will be written through RuleSet, such as detection (support regular, multi-mode matching, frequency, and other detection methods)/Whitelist/Execute plugin , etc.
- Plugin: Users can customize arbitrary detection/response logic to meet the needs of some complex scenarios, such as sending alarms to DingTalk/Feishu; linkage with CMDB for data supplementation; linkage to Redis for some cache processing. After writing, you can call these plugins in RuleSet.
- Project: Project to build a set of Elkeid HUB logic, usually consisting of an Input + one or more RuleSets + one or more Outputs
4 Elkeid Input/Input Source

4.1 Input configuration suggestions
- The input source currently only supports Kafka as the data input source. The data format supports Json or any streaming log with a clear eliminator.
- Suggested data source types:
- Alarm logs of other security products, HUB can effectively carry out secondary processing, such as linkage with other basic components to make up for the missing part of the alarm data, or through custom Action (rule engine support) to realize the automatic processing of alarms
- Basic logs, such as HTTP Mirroring Traffic /Access logs/HIDS data, etc. Through the rule engine, linkage module and anomaly detection module to the original data source for security analysis/intrusion detection/automatic defense operations
- Application audit logs, Such as: login, original SQL request, sensitive operation and other logs. HUB can customize its audit function
4.2 Input configuration instructions
Configuration field:
| Field | Description |
| InputID | Not repeatable, describe an input, only English + "_/-" + numbers |
| InputName | Describe the name of the input, can be repeated, can use Chinese |
| InputType | Currently only supports Kafka |
| DataType | json/protobuf/custom/grok |
| KafkaBootstrapServers | KafkaBootstrapServers, split IP: PORT tuple with comma |
| KafkaGroupId | GroupID used when consuming |
| KafkaOffsetReset | earliest or latest |
| KafkaCompression | Data compression algorithm in Kafka |
| KafkaWorkerSize | concurrent consumption |
| KafkaOtherConf | Other configurations are supported, for specific configuration see: https://github.com/edenhill/librdkafka/blob/master/CONFIGURATION.md |
| KafkaTopics | Consumption Topic, supports multiple Topics |
| GrokPattern | It is meaningful when the DataType is grok, and the data will be parsed and passed backwards according to the GrokPattern |
| DataPattern | It is meaningful when DataType is custom, describing the data format |
| Separator | Meaningful when the DataType is custom, the delimiter used to split the data |
All fields above are required
Configuration example (DataType: json):
InputID: wafdeny
InputName: wafdeny
InputType: kafka
DataType: json
TTL: 30
KafkaBootstrapServers: secmq1.xxx.com:9092,secmq2.xxx.com:9092,secmq3.xxx.com:9092,secmq4.xxx.com:9092
KafkaGroupId: smith-hub
KafkaOffsetReset: latest
KafkaCompression: none
KafkaWorkerSize: 3
KafkaOtherConf: ~

KafkaTopics:
  - wafdeny
5 Elkeid Output/Output

5.1 Output Configuration Recommendations
At present, the default policy of the default HUB is that the alarm does not go Output, and the plug-in is used to directly interact with the Manager to write to the database. If you need to configure the original alarm, you can consider configuring Output
Since HUB is a stream data processing tool and does not have storage capability, it is recommended to configure the output source of data storage, such as ES , Hadoop, SOC , SIEM and other platforms. Currently supported Output types are:
- Kafka
- Elasticsearch
5.2 Output configuration instructions
Configuration field:
| Field | Description |
| OutputID | Not repeatable, describe an output, only English + "_/-" + numbers |
| OutputName | Describe the name of the output, can be repeated, can use Chinese |
| OutputType | es or kafka |
| AddTimestamp | true or false, after it is enabled, a timestamp field is added to the final result and a timestamp is added (if this field already exists, it will be overwritten). The format is: 2021-07-05T11:48:14Z |
| KafkaBootstrapServers | It is meaningful when OutputType is kafka |
| KafkaTopics | It is meaningful when OutputType is kafka |
| KafkaOtherConf | It is meaningful when OutputType is kafka |
| ESHost | It is meaningful when the OutputType is es, and arrays are supported |
| ESIndex | It is meaningful when OutputType is kafka |
Configuration example (es):
OutputID: es_abnormal_dbcloud_task
OutputName: es_abnormal_dbcloud_task
OutputType: es
ESHost:
  - http://10.6.24.60:9200
ESIndex: abnormal_dbcloud_task
Configuration example (kafka):
OutputID: dc_sqlhunter
OutputName: dc_sqlhunter
OutputType: kafka
KafkaBootstrapServers: 10.6.210.112:9092,10.6.210.113:9092,10.6.210.126:9092
KafkaTopics: mysqlaudit_alert
KafkaOtherConf: ~
6 Elkeid HUB RuleSet
RuleSet is the part of HUB that implements core detection/response actions, which need to be implemented according to specific business requirements. The following figure shows the simple workflow of RuleSet in HUB:

6.1 RuleSet
HUB RuleSet is a set of rules described by XML
RuleSet has two types, rule and whitelist, as follows:
<root ruleset_id="test1" ruleset_name="test1" type="C">
... ....
</root>
<root ruleset_id="test2" ruleset_name="test2" type="rule" undetected_discard="true">
... ...
</root>
Among them, the < root > </root > of RuleSet is a fixed mode and cannot be changed at will. Other properties:
| Field | Description |
| ruleset_id | Not repeatable, describe an output, only English + "_/-" + numbers |
| ruleset_name | Describe the name of the ruleset, can be repeated, can use Chinese |
| type | It is a rule or a whitelist, where the rule means that the detection continues to pass backward, and the whitelist means that the detection does not pass backward; the concept of backward pass can be simply understood as the detection event of the ruleset |
| undetected_discard | It is meaningful only when the rule is a rule, which means whether it is discarded if it is not detected. If it is true, it will be discarded if it is not detected by the ruleset. If it is false, it will continue to pass backwards if it is not detected by the rulset |
6.2 Rule
Usually ruleset is composed of one or more rules, it should be noted that the relationship between multiple rules is an'or 'relationship, that is, if a piece of data can Hit one or more of the rules.
<root ruleset_id="test2" ruleset_name="test2" type="rule" undetected_discard="true">

    <rule rule_id="rule_xxx_1" author="xxx" type="Detection">
        ... ...
    </rule>

    <rule rule_id="rule_xxx_2" author="xxx" type="Frequency">
        ... ...
    </rule>

</root>
The basic properties of a rule are:
| field | Description |
| rule_id | Not repeatable in the same ruleset, identify a rule |
| author | Identify the author of the rule |
| type | There are two types of rules, one is Detection, which is a stateless detection type rule; the other is Frequency, which is a frequency correlation detection of data streams based on Detection |
Let's start with simple examples of two different types of rules.
Let's first assume that the data sample passed from Input to Ruleset is:
{

    "data_type":"59",

    "exe":"/usr/bin/nmap",

    "uid":"0"

}
6.2.1 Detection Simple Example
<rule rule_id="detection_test_1" author="EBwill" type="Detection">
   <rule_name>detection_test_1</rule_name>
   <alert_data>True</alert_data>
   <harm_level>high</harm_level>
   <desc affected_target="test">这是一个Detection的测试</desc>
   <filter part="data_type">59</filter>
   <check_list>
       <check_node type="INCL" part="exe">nmap</check_node>
   </check_list>
</rule>
The detection_test_1 meaning of this rule is that when the data_type with data is 59 and there is nmap in exe, the data continues to be passed backwards.
6.2.2 Frequency Simple Example
<rule rule_id="frequency_test_1" author="EBwill" type="Frequency">
   <rule_name> frequency_test_1 </rule_name>
   <alert_data>True</alert_data>
   <harm_level>high</harm_level>
   <desc affected_target="test">这是一个Frequency的测试</desc>
   <filter part="data_type">59</filter>
   <check_list>
       <check_node type="INCL" part="exe">nmap</check_node>
   </check_list>
   <node_designate>
       <node part="uid"/>
   </node_designate>
   <threshold range="30" local_cache="true">10</threshold>
</rule>
The meaning frequency_test_1 this rule is: when the data_type of data is 59, and there is nmap in exe, enter the frequency detection: when the same uid , more than > = 10 behavior occurs within 30 seconds, then the alarm, and the current HUB instance itself cache is used in this process.
We can see that in fact, Frequency is only more than Detection node_designate and threshold fields, that is, no matter what the rules, will need to have the most basic fields, we will first understand these general basic fields.
6.2.3 General field description
| field | Description |
| rule_name | Represents the name of rule, unlike rule_id, can use Chinese or other ways to better express the meaning of rule, can be repeated |
| alert_data | True or False, if True, the underlying information of the rule will be added to the current data and passed backwards; if False, the information of the rule will not be added to the current data |
| harm_level | Expressing a risk level for the rule, which can be info/low/ a /high/critical |
| desc | It is used to provide a description of the rule itself, affected_target of which is the component information for which the rule is directed, which is filled in by the user without mandatory restrictions |
| filter | The first layer of filtering data, part represents which field in the data is filtered, the specific content is the detection content, the meaning is whether there is part, the detection data, if the type of RuleSet is rule exists, the logic of the rule continues to be executed downward, if it does not exist, it is not detected downward; when the RuleSet type is whitelist, the opposite is true, that is, the detection is skipped if it exists, and the detection continues if it does not exist.
Only one filter can exist, and by default only supports "presence" logical detection |
| check_list | There can be 0 or more check_node in the check_list, a rule can only exist one check_list, where the logic of the check_node is' and 'is'and', if the type of RuleSet is rule, all check_node of them need to pass before they can continue down, if whitelist is the opposite, that is, check_node all of them do not pass before they can continue down |
| check_node | check_node is a specific test |
6.2.4 alert_data
Let's take the Decetion example above as an example:
Data to be detected:
{
    "data_type":"59",
    "exe":"/usr/bin/nmap",
    "uid":"0"

}
RuleSet:
<root ruleset_id="test2" ruleset_name="test2" type="rule" undetected_discard="true">
<rule rule_id="detection_test_1" author="EBwill" type="Detection">
   <rule_name>detection_test_1</rule_name>
   <alert_data>True</alert_data>
   <harm_level>high</harm_level>
   <desc affected_target="test">This is a detection test</desc>
   <filter part="data_type">59</filter>
   <check_list>
       <check_node type="INCL" part="exe">nmap</check_node>
   </check_list>
</rule>
</root>
If the alert_data is True , the RuleSet passes the following data backwards, incrementing SMITH_ALETR_DATA fields, including HIT_DATA details describing the Hit rule, and RULE_INFO , basic information about the rule itself:
{
    "SMITH_ALETR_DATA":{
        "HIT_DATA":[
            "test2 exe:[INCL]: nmap"
        ],
        "RULE_INFO":{
            "AffectedTarget":"all",
            "Author":"EBwill",
            "Desc":"This is a detection test",
            "DesignateNode":null,
            "FreqCountField":"",
            "FreqCountType":"",
            "FreqHitReset":false,
            "FreqRange":0,
            "HarmLevel":"high",
            "RuleID":"test2",
            "RuleName":"detection_test_1",
            "RuleType":"Detection",
            "Threshold":""
        }
    },
    "data_type":"59",
    "exe":"/usr/bin/nmap",
    "uid":"0"
}
If alert_data False , the following data is passed backwards, the original data source:
{

    "data_type":"59",

    "exe":"/usr/bin/nmap",

    "uid":"0"

}
6.2.5 check_node
The basic structure of the check_node is as follows:
<check_node type="检测类型" part="待检测路径">
   检测内容
</check_node>
6.2.5.1 detection type
The following detection types are currently supported:
| Type | Description |
| END | The content in the Path to be detected, to detect the content, end |
| NCS_END | The content in the Path to be detected, to detect the content, the end, case insensitive |
| START | The content in the Path to be detected, starting with Detect content |
| NCS_START | The content in the Path to be detected, starting with detection content, case insensitive |
| NEND | The content in the Path to be detected does not end with the detected content |
| NCS_NEND | The content in the Path to be detected does not end with Detected content, case insensitive |
| NSTART | The content in the Path to be detected does not start with the detected content |
| NCS_NSTART | The content in the Path to be detected does not start with Detected content |
| INCL | Content in Path to be detected |
| NCS_INCL | Content in Path to be detected, exists, detected content, case insensitive |
| NI | Content in Path to be detected, does not exist, detect content |
| NCS_NI | Content in Path to be detected, does not exist, detected content, case insensitive |
| MT | The content in the Path to be detected is greater than |
| LT | The content in the Path to be detected, less than, the detected content |
| REGEX | To treat the content in the detection Path, perform regular matching of the detection content |
| ISNULL | The content in the Path to be detected is empty |
| NOTNULL | The content in the Path to be detected is not empty |
| EQU | The content in the Path to be detected is equal to the detected content |
| NCS_EQU | The content in the Path to be detected is equal to the detected content, case insensitive |
| NEQ | The content in the Path to be detected is not equal to the detected content |
| NCS_NEQ | The content in the Path to be detected, is not equal to, detect the content, case insensitive |
| CUSTOM | For the content in the detection Path, perform, detect the content, specify, custom plug-in detection |
| CUSTOM_ALLDATA | Customize plug-in detection for the content to be detected; in this way, part can be empty, because it does not depend on this field, the entire data is passed to the plug-in for detection |
Next, we explain the use of the next part, which is consistent with the use of the part of the filter.
6.2.5.2 part
Suppose the data to be detected is:
{
    "data":{
        "name":"EBwill",
        "number":100,
        "list":[
            "a1",
            "a2"
        ]
    },
    "class.id":"E-19"
}
The corresponding part description is as follows:
data               =       "{\"name\":\"EBwill\",\"number\":100,\"list\":[\"a1\",\"a2\"]
data.name          =       "EBwill"
data.number        =       "100"
data.list.#_0      =       "a1"
data.list.#_1      =       "a2"
class\.id          =       "E-19"
It should be noted that if there is "." in the key to be detected, it needs to be escaped with ""
6.2.5.3 Advanced Usage check_data_type
Suppose the data to be detected is
{
    "stdin":"/dev/pts/1",
    "stdout":"/dev/pts/1"
}
Assuming we need to detect that stdin is equal to stdout , that is, our detection content comes from the data to be detected, then we need to use check_data_type = "from_ori_data" to redefine the source of the detection content is from the data to be detected rather than the content filled in , as follows:
<check_node type="EQU" part="stdin" check_data_type="from_ori_data">stdout</check_node>
6.2.5.4 Advanced Usage logic_type
Suppose the data to be detected is
{
    "data":"test1 test2 test3",
    "size": 96,
}
When we need to detect whether there is test1 or test2 in data, we can write regular to achieve, or we can define **logic_type to achieve check_node support "AND" or "OR" logic **, as follows:
<!-- Value "test1" or "test2" exist in "data" field -->
<check_node type="INCL" part="data" logic_type="or" separator="|">
    <![CDATA[test1|test2]]>
</check_node>

<!-- Value "test1" or "test2" exist in "data" field  -->
<check_node type="INCL" part="data" logic_type="and" separator="|">
    <![CDATA[test1|test2]]>
</check_node>
Among them logic_type is used to describe logical types, support "and" and "or", and separator is used to customize the way to identify cut detection data
6.2.5.5 advanced usage of foreach
When we need to have more complex detection of arrays, it may be solved by foreach.
Suppose the data to be detected is
{
    "data_type":"12",
    "data":[
        {
            "name":"a",
            "id":"14"
        },
        {
            "name":"b",
            "id":"98"
        },
        {
            "name":"c",
            "id":"176"
        },
        {
            "name":"d",
            "id":"172"
        }
    ]
}
We want to filter out the obj of the data with id > 100 and the top-level data_type equal to 12, then we can traverse through foreach first, and then judge the traversed data, as follows:
<check_list foreach="d in data">
    <check_node type="MT" part="d.id">100</check_node>
    <check_node type="EQU" part="data_type">12</check_node>
</check_list>
Multiple pieces of data are passed downsteam:
{
    "data_type":"12",
    "data":[
        {
            "name":"c",
            "id":"176"
        }
    ]
}

#with another output

{
    "data_type":"12",
    "data":[
        {
            "name":"d",
            "id":"172"
        }
    ]
}
We can better understand the advanced usage of foreach through the following figure

Suppose the data to be detected is
{
    "data_type":"12",
    "data":[
        1,
        2,
        3,
        4,
        5,
        6,
        7
    ]
}
If we want to filter out the data less than 5 in the data, we need to write it like this:
<check_list foreach="d in data">
    <check_node type="LT" part="d">5</check_node>
</check_list>
6.2.5.6 Advanced Usage cep
By default, the relationship between the checknode and the data will be checked out when all the detection conditions of the checknode are met. When you need to customize the relationship between the checknode, you can use cep to solve it.
Suppose the data to be detected is
{
    "data_type":"12",
    "comm":"ETNET",
    "node_name":"p23",
    "exe":"bash",
    "argv":"bash"
}
We want to node_name equal to p23 or comm equal to ETNET, and exe and argv equal to bash , such data is filtered out, as follows:
<check_list cep="(a or b) and c">
    <check_node part="comm" group="a" type="INCL" check_data_type="static">ETNET</check_node>
    <check_node part="nodename" group="b" type="INCL" check_data_type="static">p23</check_node>
    <check_node part="exe" group="c" type="INCL" check_data_type="static">bash</check_node>
    <check_node part="argv" group="c" type="INCL" check_data_type="static">bash</check_node>
</check_list>
You can declare check_node as a group, and then write cep write conditions for the group in cep. Support **or **and **and **.
6.2.6 Frequency field
The logic of Frequency check_list, but after the data passes through filter and check_list, if the current rule is of type Frequency, it will enter the special detection logic of Frequency. Frequency has two fields, **node_designate **and **threshold **, as follows:
<node_designate>
    <node part="uid"/>
    <node part="pid"/>
</node_designate>
<threshold range="30">5</threshold>
6.2.6.1 node_designate
Where node_designate is on behalf of group_by , the meaning of the above example is to group_by the two fields uid and pid.
6.2.6.2 threshold
threshold is a description of the specific detection content of frequency detection: how many times (range) occurs (threshold). As expressed in the above example: the same uid and pid appear 5 times within 30 seconds is detected, where the unit of range is seconds.

As shown in the figure above, since it occurs 5 times in only 10s, all data with pid = 10 and uid = 1 that occurs in the remaining 20s will be alerted, as follows:

But this problem can cause too much alarm data, so a parameter called: hit_reset parameter called:
<node_designate>
    <node part="uid"/>
    <node part="pid"/>
</node_designate>
<threshold range="30" hit_reset="true" >5</threshold>
When hit_reset is true, the time window is remastered each time the threshold policy is satisfied, as follows:

In the scene of frequency detection, there is also a problem of performance, because this kind of stateful detection needs to save some intermediate states, this part of the intermediate state data we stored in Redis, but if the amount of data is too large, Redis will have a certain impact, so we also support the use of frequency detection using HUB's own Local Cache to store these intermediate state data, but it will also lose the global, the way to open is to set **local_cache parameter is true **:
<node_designate>
    <node part="uid"/>
    <node part="pid"/>
</node_designate>
<threshold range="30" local_cache="true" hit_reset="true" >5</threshold>
The reason for the loss of globalization is that the cache only serves the HUB instance it belongs to. If it is in cluster mode, the Local Cache is not shared with each other, but it will bring certain performance improvement.
6.2.6.3 Advanced Usage count_type
In some cases, we do not want to calculate the frequency to calculate "how many times", but there will be some other requirements, **such as how many classes appear , how much data appear in the field, and how much. **Let's look at the first requirement, how many classes appear.
Suppose the data to be detected is
{
    "sip":"10.1.1.1",
    "sport":"6637",
    "dip":"10.2.2.2",
    "dport":"22"
}
When we want to write a rule for detecting scanners, we often don't care how many times a IP access other assets, but how many different other assets are accessed. When this data is large, there may be the possibility of network scanning detection. **Within 3600 seconds, the number of different IP accessed by the same IP is recorded if it exceeds 100 **, then his frequency part rule should be written like this:
<node_designate>
    <node part="sip"/>
</node_designate>
<threshold range="3600" count_type="classify" count_field="dip">100</threshold>
At this time **count_type **needs to be classify; count_field is the field that the type calculation depends on, that is, dip.
The second scenario assumes that the data to be detected is
{
    "sip":"10.1.1.1",
    "qps":1
}
Suppose we need to filter out data with a total of qps greater than 1000 in 3600s, then we can write it like this:
<node_designate>
    <node part="sip"/>
</node_designate>
<threshold range="3600" count_type="sum" count_field="qps">1000</threshold>
By default hub count numbers of data flows when **count_type is empty. When classify is assigned, the distinct value is calculated. When **the **sum **is assigned, the sum of values for appointing field will be calculated.
6.2.7 append
When we want to add some information to the data, we can use append to add data. The syntax of append is as follows:
<append type="append类型" rely_part="依赖字段" append_field_name="增加字段名称">增加内容</append>
6.2.7.1 append - STATIC
Suppose the data to be detected is
{
    "alert_data":"data"
}
Assuming that the data has passed filter/check_list/frequency detection (if any), then we want to add some fixed data to the data, such as: data_type: 10, then we can increase it in the following ways:
<append type="static" append_field_name="data_type">10</append>
We will get the following data:
{
    "alert_data":"data",
    "data_type":"10"
}
6.2.7.2 append - FIELD
Suppose the data to be detected is
{
    "alert_data":"data",
    "data_type":"10"
}
If we want to add a field to this data: data_type_copy: 10 (from the data_type field in the data), then we can write it as follows:
<append type="field" rely_part="data_type" append_field_name="data_type_copy"></append>
6.2.7.3 append
Suppose the data to be detected is
{
    "sip":"10.1.1.1",
    "sport":"6637",
    "dip":"10.2.2.2",
    "dport":"22"
}
If we want to query the CMDB information of sip through external API, then we cannot achieve it through simple rules in this scenario, and we need to use Plugin to achieve it. The specific writing method of Plugin will be explained below. Here we first introduce if we call custom Plugin in RuleSet, as follows:
append type="CUSTOM" rely_part="sip" append_field_name="cmdb_info">AddCMDBInfo</append>
Here we will pass the data of the fields in the rely_part to the AddCMDBInfo plugin for data query, and append the plugin return data to cmdb_info data, as follows:
{
    "sip":"10.1.1.1",
    "sport":"6637",
    "dip":"10.2.2.2",
    "dport":"22",
    "cmdb_info": AddCMDBInfo(sip) --> The data in cmdb_info is the return data of the plugin AddCMDBInfo(sip)
}
6.2.7.4 CUSTOM_ALLORI
Suppose the data to be detected is
{
    "sip":"10.1.1.1",
    "sport":"6637",
    "dip":"10.2.2.2",
    "dport":"22"
}
If we want to query the permission relationship between sip and dip through the API of the internal permission system, then we also need to use the plugin to achieve this query, but our imported parameter of the plugin is not unique, we need to pass the complete data to be detected into the plugin, written as follows:
<append type="CUSTOM_ALLORI" append_field_name="CONNECT_INFO">AddConnectInfo</append>
We can get:
{
    "sip":"10.1.1.1",
    "sport":"6637",
    "dip":"10.2.2.2",
    "dport":"22",
    "CONNECT_INFO": AddConnectInfo({"sip":"10.1.1.1","sport":"6637","dip":"10.2.2.2","dport":"22"}) --> CONNECT_INFO中的数据为插件AddConnectInfo的返回数据
}
6.2.7.5 GROK
Append supports grok parsing for the specified field and appends the parsed data to the data stream:
<append type="GROK" rely_part="data" append_field_name="data2"><![CDATA[
%{COMMONAPACHELOG}]]></append>
The above example will data data for % {COMMONAPACHELOG} after parsing the new data2 field, stored in the parsed data.
6.2.7.6 6.2.7.6 Other
Append can exist multiple times in a rule, as follows:
<rule rule_id="rule_1" type="Detection" author="EBwill">
    ...
    <append type="CUSTOM_ALLORI" append_field_name="CONNECT_INFO">AddConnectInfo</append>
    <append type="field" rely_part="data_type"></append>
    <append type="static" append_field_name="data_type">10</append>
    ...
</rule>
6.2.8 del
When we need to do some clipping of the data, we can use the del field to operate.
Suppose the data to be detected is
{
    "sip":"10.1.1.1",
    "sport":"6637",
    "dip":"10.2.2.2",
    "dport":"22",
    "CONNECT_INFO": "false"
}
Assuming we need to remove the field CONNECT_INFO, I can write it as follows:
<del>CONNECT_INFO</del>
The following data can be obtained:
{
    "sip":"10.1.1.1",
    "sport":"6637",
    "dip":"10.2.2.2",
    "dport":"22"
}
Del can be written multiple times, which need to be separated by ";", as follows:
<del>CONNECT_INFO;sport;dport</del>
The following data can be obtained:
{
    "sip":"10.1.1.1",
    "dip":"10.2.2.2"
}
6.2.9 modify
When we need to process complex data, append and del cannot meet the needs, such as flattening the data, changing the key of the data, etc. At this time, we can use modify to operate. It should be noted that modify only supports plugins. The usage method is as follows:
<modify>plugin_name_no_space</modify>
The process is as follows:

6.2.10 Action
When we need to do some special operations, such as linkage with other systems, send alarms to DingTalk/Lark/mail, linkage WAF Ban IP and other operations, we can use Action to achieve related operations. It should be noted that only plugins are supported. The usage method is as follows:
<action>emailtosec</action>
The input data of the plugin emailtosec is the current data, and other operations can be written as required.
Action also supports multiple plugins. The usage method is as follows, and you need to press ";" to separate them:
<action>emailtosec1;emailtosec2</action>
In the above example, both emailtosec1 and emailtosec2 will be triggered to run.
6.3 Detection/Execution Sequence

It should be noted that the data is dynamic in the process of passing the Rule, that is, if it passes the append, then the next data received by the del is the data after the append takes effect.
6.3.1 The relationship between Rules
For the relationship where Rule is "OR" in the same RuleSet, suppose the RuleSet is as follows:
<root ruleset_id="test2" ruleset_name="test2" type="rule" undetected_discard="true">
<rule rule_id="detection_test_1" author="EBwill" type="Detection">
   <rule_name>detection_test_1</rule_name>
   <alert_data>True</alert_data>
   <harm_level>high</harm_level>
   <desc affected_target="test">This is a Detection test 1</desc>
   <filter part="data_type">59</filter>
   <check_list>
       <check_node type="INCL" part="exe">redis</check_node>
   </check_list>
</rule>
<rule rule_id="detection_test_2" author="EBwill" type="Detection">
   <rule_name>detection_test_2</rule_name>
   <alert_data>True</alert_data>
   <harm_level>high</harm_level>
   <desc affected_target="test">This is a Detection test 2</desc>
   <filter part="data_type">59</filter>
   <check_list>
       <check_node type="INCL" part="exe">mysql</check_node>
   </check_list>
</rule>
</root>
Assuming that the exe field of the data is mysql-redis, it will be detection_test_1 detection_test_2 will be triggered and two data will be passed backwards, which belong to the two rules
6.4 More examples
<rule rule_id="critical_reverse_shell_rlang_black" author="lez" type="Detection">
    <rule_name>critical_reverse_shell_rlang_black</rule_name>
    <alert_data>True</alert_data>
    <harm_level>high</harm_level>
    <desc kill_chain_id="critical" affected_target="host_process">There may be behavior that creates an R reverse shell</desc>
    <filter part="data_type">42</filter>
    <check_list>
        <check_node type="INCL" part="exe">
            <![CDATA[exec/R]]>
        </check_node>
        <check_node type="REGEX" part="argv">
            <![CDATA[(?:\bsystem\b|\bshell\b|readLines.*pipe.*readLines|readLines.*writeLines)]]>
        </check_node>
    </check_list>
    <node_designate>
    </node_designate>
    <del />
    <action />
    <alert_email />
    <append append_field_name="" rely_part="" type="none" />
</rule>
<rule rule_id="init_attack_network_tools_freq_black" author="lez" type="Frequency">
    <rule_name>init_attack_network_tools_freq_black</rule_name>
    <freq_black_data>True</freq_black_data>
    <harm_level>medium</harm_level>
    <desc kill_chain_id="init_attack" affected_target="service">Multiple use of network attack tools, possible man-in-the-middle/network spoofing</desc>
    <filter part="SMITH_ALETR_DATA.RULE_INFO.RuleID">init_attack_network</filter>
    <check_list>
    </check_list>
    <node_designate>
        <node part="agent_id" />
        <node part="pgid" />
    </node_designate>
    <threshold range="30" local_cache="true" count_type="classify" count_field="argv">3</threshold>
    <del />
    <action />
    <alert_email />
    <append append_field_name="" rely_part="" type="none" />
</rule>
<rule rule_id="tip_add_info_01" type="Detection" author="yaopengbo">
    <rule_name>tip_add_info_01</rule_name>
    <harm_level>info</harm_level>
    <threshold/>
    <node_designate/>
    <filter part="data_type">601</filter>
    <check_list>
        <check_node part="query" type="CUSTOM">NotLocalDomain</check_node>
    </check_list>
    <alert_data>False</alert_data>
    <append type="FIELD" rely_part="query" append_field_name="tip_data"></append>
    <append type="static" append_field_name="tip_type">3</append>
    <append type="CUSTOM_ALLORI" append_field_name="tip_info">AddTipInfo</append>
    <del/>
    <alert_email/>
    <action/>
<desc affected_target="tip">DNS added domain name with threat intel information</rule>
6.5 Suggestions for rule writing
- Good use of filter can greatly reduce performance pressure, the goal of filter writing should be to let as little data as possible into the CheckList
- Use as little regularity as possible
7 Elkeid HUB Plugin/Plugin
Elkeid HUB Plugin is used to remove some restrictions of Ruleset in the writing process and improve the flexibility of HUB use. By writing plugins, you can achieve some operations that cannot be done by writing Ruleset. At the same time, if you need to interact with third-party components that are not currently supported, you can only do so by writing plugins.
Elkeid HUB currently supports both Golang Golang Plugin and Python Plugin. The current stock Plugin is developed with Golang developed with Golang and loaded through the Golang Golang Plugin mechanism. Due to limitations, it is no longer open to the public, but it can still be used in the preparation of Ruleset Golang Plugin. Currently only open to the public Python Plugin.
Python The essence of the Plugin is to execute the Python Python script through another process while the HUB is running, and return the execution result to the Elkeid HUB.
Plugin has a total of 6 types, all of which are introduced in the doc written in Ruleset. The following will introduce each plugin in combination with the above examples. The type name of Plugin does not correspond to the tag name in Ruleset one by one. In actual use, please strictly follow the doc.
7.1 Introduction of common parameter
7.1.1 Format
Each Plugin is a Python Class. When the plugin is loaded, HUB will instantiate this Class and assign the name, type, log, redis four variables. Each time the plugin is executed, the plugin_exec method of the class will be called.
Classes are as follows:
class Plugin(object):

    def __init__(self):
        self.name = ''
        self.type = ''
        self.log = None
        self.redis = None

    def plugin_exec(self, arg, config):
        pass
7.1.2 init
init method contains the following four variables:
- name: Plugin Name
- type: Plugin Type
- log: logging
- redis: redis client
If you have your own init logic, you can add it at the end
7.1.3 plugin_exec
plugin_exec aspect has two parameters, arg and config.
- Arg is the parameter that the plugin accepts when executing. Depending on the plugin type, arg is string or dict ().
For Action, Modify, Origin, OriginAppend four types of plugins, arg is dict () dict () .
For Append, Custom has two types of plugins, arg is string.
- Config is an additional parameter that the plugin can accept. Currently only Action and Modify support it. If it is specified in Ruleset, it will be passed to the plugin through the config parameter.
For example: add extra tag in ruleset, HUB will call plugin_exec method with config imported parameter in the form of dict. Extra uses : as kv the delimiter of ; as the delimiter of each group of kv
<action extra="mail:xxx@bytedance.com;foo:bar">PushMsgToMatao</action>
config = {"mail":"xxx@bytedance.com"}
7.2 example
7.2.1 Plugin之Action
See 6.2.10 for the role in rule.
Action is used to perform some additional operations after the data passes through the current rule.
An Action plugin receives a copy of the entire data stream. Returns whether the action was successfully executed. Whether the action is successfully executed does not affect whether the data flow continues to go down, it will only be reflected in the HUB's log.
Implementation Reference
class Plugin(object):


    def __init__(self):
        self.name = None
        self.type = None
        self.log = None
        self.redis = None


    def plugin_exec(self, arg, config):
        # Example: request a callback address
        requests.post(xxx)
        result = dict()
        result["done"] = True
        return result
7.2.2 Append of Plugin of Plugin
For the role of rule, see 6.2.7.3
Append and OriginAppend are similar in that both Append operations can be customized. The difference is that Append accepts a certain attribute value determined in the data stream, while OriginAppend accepts a copy of the entire data stream. The return value of both will be written to the specified attribute in the data stream.
implementation reference
class Plugin(object):
    def __init__(self):
        self.name = None
        self.type = None
        self.log = None
        self.redis = None
    def plugin_exec(self, arg, config):
        result = dict()
        result["flag"] = True
        # Add the __new__ suffix after the original arg
        result["msg"] = arg + "__new__"
        return result
7.2.3 Custom of Plugin of Plugin
For the role of rule, see Custom in 6.2.5.2.
CUSTOM is used to implement custom CheckNode. Although more than 10 common judgment methods are predefined in CheckNode, they cannot be completely covered in the actual rule writing process, so the plugin is opened to have more flexible judgment logic.
The parameter received by the plugin is the property value specified in the data stream, and the return is whether to Hit and write the part in the hit.
implementation reference
class Plugin(object):
    def __init__(self):
        self.name = None
        self.type = None
        self.log = None
        self.redis = None
    def plugin_exec(self, arg, config):
        result = dict()
        # If the length of arg is 10
        if arg.length() == 10:
            result["flag"] = True
            result["msg"] = arg
        else:
            result["flag"] = True
            result["msg"] = arg
        return result
7.2.4 Modify the Plugin the Plugin
Role in rule see 6.2.9
Modify is the most flexible plugin of all plugins. When writing ruleset or other plugins cannot meet the needs, you can use the modify plugin to obtain full manipulation of data flow.
The imported parameter of the Modify plugin is a piece of data in the current data stream. The return is divided into two cases, which can return a single piece of data or multiple pieces of data.
When returning a single piece of data, Flag is true, the data is in Msg, when returning multiple pieces of data, MultipleDataFlag is true, and the data is in the array MultipleData. If both Flag and MultipleDataFlag are true, it is meaningless.
Implementation reference 1:
class Plugin(object):
    def __init__(self):
        self.name = None
        self.type = None
        self.log = None
        self.redis = None
    def plugin_exec(self, arg, config):
        result = dict()
        # Modify the data at will, such as adding a field
        arg["x.y"] = ["y.z"]
        result["flag"] = True
        result["msg"] = arg
        return result
Implementation reference 2:
class Plugin(object):
    def __init__(self):
        self.name = None
        self.type = None
        self.log = None
        self.redis = None
    def plugin_exec(self, arg, config):
        result = dict()
        # Copy the piece of data into 5 points
        args = []
        args.append(arg)
        args.append(arg)
        args.append(arg)
        args.append(arg)
        args.append(arg)
        result["multiple_data_flag"] = True
        result["multiple_data"] = args
        return result
2.5 Origin of the Plugin of the Plugin
For the role of rule, see 6.2.5.2 CUSTOM_ALLORI
The advanced version of the Custom plug-in, instead of checking a field in the data stream, checks the entire data stream. The imported parameter changes from a single field to the entire data stream.
implementation reference
class Plugin(object):
    def __init__(self):
        self.name = None
        self.type = None
        self.log = None
        self.redis = None
    def plugin_exec(self, arg, config):
        result = dict()
        # If the length of arg["a"] and arg["b"] are both 10
        if arg["a"].length() == 10 and arg["b"].length() == 10:
            result["flag"] = True
            result["msg"] = ""
        else:
            result["flag"] = False
            result["msg"] = ""
        return result
7.2.6 Plugin之OriginAppend
For the role of rule, see 6.2.7.4
The advanced version of the Append plug-in no longer judges a field in the data stream and appends, but judges the entire data in the data stream. The imported parameter becomes the entire data stream from a single field.
implementation reference
class Plugin(object):
    def __init__(self):
        self.name = None
        self.type = None
        self.log = None
        self.redis = None
    def plugin_exec(self, arg, config):
        result = dict()
        result["flag"] = True
        # merge two fields
        result["msg"] = arg["a"] + "__" + arg["b"]
        return result
7.3 Plugin development process
The runtime environment of the plugin is pypy3.7-v7.3.5-linux64, if you want python scripts to run normally, you need to test in this environment.
HUB itself introduces some basic dependencies, but it is far from covering python common packages. When necessary, users need to install them by themselves in the following ways.
- Venv is located under/opt/Elkeid_HUB/plugin/output/pypy, you can switch to venv with the following command and execute pip install to install.
source /opt/Elkeid_HUB/plugin/output/pypy/bin/activate
- Call pip module in the plugin's init method pip module in the plugin's init method
7.3.1 Creating a Plugin
- Click the Create plugin button

- Fill in the information as required

- Click Confirm to complete the creation

- View Plugin

- Download plugin
When the Plugin is successfully created, the Plugin will be automatically downloaded, and then you can also click the Download button on the interface to download again

7.3.2 Online Development & Testing Plugin
Click Name or click the View Plugin button to bring up Plugin.py preview screen where you can preview & edit the code.
The editor is in read-only mode by default. Click the Edit button, the editor will switch to read-write mode, and the Plugin can be edited at this time.

After editing, you can click the Confirm button to save, or click the Cancel button to discard the changes.
After clicking the Confirm button, the changes will not take effect in real time. Similar to Ruleset, the Publish operation is also required.
7.3.3 Local Development Plugin
Unzip the automatically downloaded zip package when creating the plugin, you can use IDE Open, execute test.py to test the plugin.
After the test is correct, you need to manually compress the zip file for uploading.
Pay attention when compressing, make sure all files are in the root directory of zip.

7.3.4 Uploading the Plugin
- Click the Upload button in the interface

- Same as policy release, publish the policy in the policy release interface
7.4 Common development dependencies of Plugin
7.4.1 requests
Elkeid HUB introduces the requests library by default, which can be used to implement http requests.
The reference code is as follows:
import requests
import json
def __init__(self):
    ...

def plugin_exec(self, arg, config):
    p_data = {'username':user_name,'password':user_password}
    p_headers = {'Content-Type': 'application/json'}
    r = requests.post("http://x.x.x.x/", data=json.dumps(p_data), headers=p_headers)
    result["flag"] = True
    result["msg"] = r.json()['data']
    return result
7.4.2Redis
Plugin Object After executing init method, before executing plugin_exec method, HUB will set the redis connection to the self.redis, and then you can call redis in the plugin_exec method. The redis is the redis configured by HUB itself, and the library used is https://github.com/redis/redis-py.
The reference code is as follows:
redis_result = self.redis.get(redis_key_prefix + arg)

self.redis.set(redis_key_prefix + arg, json.dumps(xxx), ex=random_ttl())
7.4.3Cache
Elkeid HUB introduces the cacheout library by default, you can use the cacheout library to achieve local cache, or with redis to achieve multi-level cache. cacheout doc reference https://pypi.org/project/cacheout/.
Simple example:
from cacheout import LRUCache
class Plugin(object):
    def __init__(self):
        ...
        self.cache = LRUCache(maxsize=1024 * 1024)
        ...

    def plugin_exec(self, arg, config):
        ...
        cache_result = self.cache.get(arg)
        if cache_result is None:
           pass
        ...
        self.cache.set(arg, query_result, ttl=3600)
        ...
Cooperate with redis to achieve multi-level cache:
from cacheout import LRUCache
class Plugin(object):
    def __init__(self):
        ...
        self.cache = LRUCache(maxsize=1024 * 1024)
        ...

    def plugin_exec(self, arg, config):
        ...
        cache_result = self.cache.get(arg)
        if cache_result is None:
            redis_result = self.redis.get(redis_key_prefix + arg)
            if redis_result is None:
                # fetch by api
                ...
                self.redis.set(prefix + arg, json.dumps(api_ret), ex=random_ttl())
                self.cache.set(arg, ioc_query_source, ttl=3600)
            else:
                # return
                ...
        else:
            # return
            ...
8 Project/Project
8.1 Project
Project is the smallest unit of the executed policy, which mainly describes the data process in the data flow. From the beginning of Input to the end of Output or RuleSet, let's look at an example:
INPUT.hids --> RULESET.critacal_rule
RULESET.critacal_rule --> RULESET.whitelist
RULESET.whitelist --> RULESET.block_some
RULESET.whitelist --> OUTPUT.hids_alert_es

Let's describe the configuration of this Project:
INPUT.hids consume data remotely and pass it to RULESET.critacal _rule
RULESET.critacal _rule the detected data to the RULESET.whitelist
RULESET.whitelist the detected data to RULESET.block _some and OUTPUT.hids _alert_es
RULESET.block _some may be to perform some blocking operations through action linkage with other components, OUTPUT.hids _alert_es is obviously to send data to the external es
8.2 About ElkeidDSL syntax
There are several concepts in HUB:
| Name/Operator | Desc | SmithDSL | Example |
|---|---|---|---|
| INPUT | Data input source | INPUT.inputID | INPUT.test1 |
| OUTPUT | Data output source | OUTPUT.outputID | OUTPUT.test2 |
| RULESET | Ruleset | RULESET.rulesetID | RULESET.test3 |
| —> | Data Pipline | —> | INPUT.A1 —> RULESET.A |
8.3 About data transfer
Data transfer can use: -- > to indicate.
If we want to pass the data input source HTTP_LOG to the rule set HTTP:
INPUT.HTTP_LOG --> RULESET.HTTP
If we want the above alarm to be output SOC_KAFKA data output source:
INPUT.HTTP_LOG --> RULESET.HTTP
RULESET.HTTP --> OUTPUT.SOC_KAFKA
If we want the above alarms to be SOC_KAFKA and SOC_ES data output source:
INPUT.HTTP_LOG --> RULESET.HTTP
RULESET.HTTP --> OUTPUT.SOC_KAFKA
RULESET.HTTP --> OUTPUT.SOC_ES
9 Elkeid HUB Front End User Guide
The front end mainly includes five parts: Home, RuleEdit (rule page), Publish (rule publishing), Status (log/status), User Management (system management), Debug (rule testing). This part only introduces the use of the front end page, specific rule configuration and field meaning, please refer to the previous chapters.RuleEdit (rule page), Publish (rule publishing), Status (log/status), User Management (system management), Debug (rule testing)
9.1 Usage process
- Rules release:
- Go to the Rules page -- > Input Source/Output/Rule Set/Plugin/Item to make relevant edits and modifications.
Go to the Rule Publishing-- > Rule Publishing page to publish the rule to the hub cluster. - Project operation:
- Go to the rule publishing -- > project operation page start/stop/restart corresponding to the project.
9.2 Home

The home page mainly includes **HUB status information **, **QPS information **, **HUB occupancy information **, **toolbar **. Toolbar includes Chinese and English switching, page mode switching and notification bar information.

QPS The information shows the overall qps information of Input and Output, and the data is updated every 30 seconds. This is only displayed as a global display. If you need to view more detailed information, you can go to the rule page -- > project -- > project details page to view.

The HUB occupancy information analyzes the HUB occupancy by analyzing the CPU time used by the ruleset, and gives a bar graph of the HUB occupancy information, including the CPU time and proportion used by the rule set.
9.3 Rule Edit/Rule Page
All rules (including Input/Output/Ruleset/Plugin/Project) are added, deleted, and modified in RuleEdit.
The edited rules here are not automatically published to the HUB cluster. If you need to publish, please go to the Publish-- > RulePublish page to operate.
In order to quickly find their own related configurations, the configuration list will be divided into two tabs, My Subscription shows the user's favorite configuration information, and the other shows all the configurations (such as input). Users can go to All Configurations first to find the configuration they need to manage and bookmark the configuration for the next modification.
9.3.1 Input/Input Sources

The input source page supports adding and importing files:
- Add: Click Add, the following page will appear, the specific field meaning can refer to the above **Elkeid Input **section.

- File import: First create an input file according to your needs, which currently supports yml format. Examples are as follows.
InputID: test_for_example
InputName: test_for_example
InputType: kafka
DataType: json
TTL: 30
KafkaBootstrapServers: test1.com:9092,test2.com:9092
KafkaGroupId: hub-01
KafkaOffsetReset: latest
KafkaCompression: none
KafkaWorkerSize: 3
KafkaOtherConf: ~

KafkaTopics:
  - testtopic
Then click Import, select the file to be imported, and then confirm the import after the pop-up box.

- sampling
Click Sample to get the sampled data during the operation of the input source.


9.3.2 Output/Output
The use of the output is similar to the input source, supporting elasticsearch , kafka , influxdb three types.

9.3.3 RuleSet/Rule Set
- ruleset page
Similarly, the rule set also supports page addition and file import, and also supports full export of all rules.

**Sample **Button to view the input/output sample data for this rule (if the rule has no data coming in, there will be no data).
Test will test the **non-encrypted **rule set, take the test data as input, and record the Hit profile after the data flows into the rule set. If you choose **Coloring Rule **, then the specific data of Hit will be recorded. ( **There is load on the database. It is recommended to consider the number and size of test data **). If the rule set is running, you can use **Load Data **Load Sample Data and Test. See Rule Testing/Debug page for details

**Create copy **The button creates a replica set of rules using the current ruleset as a template, with the suffix rulesetid and rulesename _copy:

**Search within rule set **Provides a global search for all rule sets. Matches the rule ID corresponding to all rule sets. Users can jump to edit or delete the rule if the search results.

- rules page
Click the rule set ID **rule set ID **button to view its details and enter the rule edit page.


**New **button is to add a rule to the current rule set. Here support **XML editing **and **table editing **two ways, by clicking **form editing **and **XML editing **to switch.


**Test **The button supports testing a single rule, the sample button can import sample data from the Hub (if any), click execute, and the sample data will be sent to the Hub instance for testing. Testing does not affect the online data flow.

9.3.4 Plugins/Plugins
For details, see 7.3 Plugin Development Process
9.3.5 Project/Project
**project **Page addition and file import are also supported. Running/Stopped/Unknown represents the number of machines running/not running/unknown for the project, respectively. In particular, the status data is updated every 30s.

Click on the **project ID **Go to the project details page. You can view the project details, Input lag (only kafka ), the qps information of each component qps information. At the same time, right-click on the node in the node graph to view the node SampleData or jump to the node details.

**Test **The button will test the project that does not contain the encrypted rule set, and the test process is the same as the rule set test.

9.4 Publish/Rules
All operations involving changes to the hub cluster are under this page.
9.4.1 RulePublish/Rule Publishing
Rules are published here, and the edited rule change operation can be seen on this page.
**Commit the changes **, publish the changes to the HUB cluster; **undo the changes **, discard all changes, and roll back the rule to the previous stable version (the version where the changes were last committed).

Click on **diff **to see details of the change

After submitting the changes, it will automatically jump to the Task Detail page. You can view the number of successful and failed machines, failed error messages, and the change details and diff of this task task .

9.4.2 Project Operation/Project Operation
This page is used to control the start, stop and restart of projects. All new projects are stopped by default and need to be manually opened on this page.

9.4.3 Task/Task List
The task list page shows all the tasks that have been assigned to the hub cluster.

9.5 Status/Status Page
Status is used to display the running status of the HUB, error events and leader operation records.
9.5.1 Event/HUB event
Event is the error information generated by the HUB. The leader collects the error information and aggregates it, so each information may be an error that occurred jointly by multiple hub machines over a period of time. You can see the event level, number of hosts, location and information in the list. You can filter by time and Event type at the top. Click the small arrow on the left to expand and view the error details.

Each error message contains details of the error, trace, and the hub machine's ip : port.
9.5.3 Log/operation log
Log is used to record the modification of the HUB. Log contains URL, operation user, IP, time and other information, which can be filtered by time above.

9.6 System Management/System Administration
This page is used to manage HUB users. Users can create new users, delete users, and manage user rights
9.6.1 User Management

Click Add User to create a new user, set the user's username, password, and user level in the interface, the user level is divided into 6 levels, namely admin , manager , hub readwirte , hub readonly .
- **admin **Users can access all pages and interfaces
- **Manager **Users can access pages and interfaces other than user manager
- **hub readwrite **Users can use normal pages and interfaces related to the hub readwrite permissions
- **hub readonly **Users can use normal hub readonly pages and interfaces
9.8 Debug/Rule Testing
It is used to test the already written **rules **/ **rule sets **/ **projects **to test whether its function is as expected.

DataSource, Debug Config, and Debug Task are associated as follows:
Each **configuration **contains a copy of **data **, and a test component (rule, ruleset, or project). **Configuration **creates **task **assigns it a Host, **the task **is executed, it is executed only on that Host.

9.8.1 Data Source/Data
Data source, can be understood as a type of configurable, limit the number of data consumption **input source **.


- types : Data source types, there are two types:
- debug_user_input (custom) : User input data source;
- debug_topic (streaming) : Actual input source, this type of data is limited to consume 50 input sources.
- Associated configuration : Associated configuration list, showing the Debug Config using the data source Debug Config
- Associated input source : Represents the input source represented by this data source, only if the type is debug_topic is not empty.
9.8.2 Debug Config/Configuration

Field description:
- type : Configuration type, indicating which test component the configuration was created based on
- Coloring rule : Represents the rule node of "coloring". After selecting the rule that needs to be "coloring", the data passing through this rule will be marked with coloring fields. You can not select it, at this time, the **configuration **The generated **task **will not collect specific data.
- Status : Configuration status:
- All configured Ready to complete, now you can create a task
- Unconfirmed Data may not be configured **Data **or **data **deleted, need to create **data **to create data
- test Profile, no coloring rule configured, you can create a task at this time, but will not collect specific data, only see the profile data of each node (input/ruleset/output), such as In/Out (the number of data flowing into the rule, the number of data flowing out of the rule).
9.8.3 Debug Task/Task

Field description:
- Task Status: Status
- undefined : Undefined, the task may be deleted due to hub upgrade or exit, and the result cannot be viewed at this time
- Ready : Ready, click Start Task to execute the task
- Running : Running
- Completed : Run successfully, click **View Results **to view results
Result page:

- Top left: DSL Figure. It is convenient to view the project structure of the test, and the task is ID
- Bottom left: Overview of the results. Shows the inflow/outflow of data from each node.
- In : In number of data
- Out Number of Data Outflows
- LabelIn : Coloring Data LabelIn Number
- LabelOut : Coloring Data LabelOut Jump
- Right: detail result. You can view the coloring data of this task and support paging query